. 2016 Jul 5;113(27):E3892-900.
doi: 10.1073/pnas.1600582113. Epub 2016 Jun 20.

Versatile in vivo regulation of tumor phenotypes by dCas9-mediated transcriptional perturbation

Affiliations

Versatile in vivo regulation of tumor phenotypes by dCas9-mediated transcriptional perturbation

Christian J Braun et al. Proc Natl Acad Sci U S A. .

Abstract

Targeted transcriptional regulation is a powerful tool to study genetic mediators of cellular behavior. Here, we show that catalytically dead Cas9 (dCas9) targeted to genomic regions upstream or downstream of the transcription start site allows for specific and sustainable gene-expression level alterations in tumor cells in vitro and in syngeneic immune-competent mouse models. We used this approach for a high-coverage pooled gene-activation screen in vivo and discovered previously unidentified modulators of tumor growth and therapeutic response. Moreover, by using dCas9 linked to an activation domain, we can either enhance or suppress target gene expression simply by changing the genetic location of dCas9 binding relative to the transcription start site. We demonstrate that these directed changes in gene-transcription levels occur with minimal off-target effects. Our findings highlight the use of dCas9-mediated transcriptional regulation as a versatile tool to reproducibly interrogate tumor phenotypes in vivo.

Keywords: CRISPR; cancer genetics; cancer models; cancer therapeutic resistance; gene regulation.


Conflict of interest statement

The authors declare no conflict of interest.

Figures

Fig. 1.
Fig. 1.
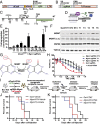
dCas9 targeted to the TSS of Trp53 leads to a potent and sustainable loss of TRP53 function. (A) A vector diagram of MSCV-dCas9-GFP. (B) A vector diagram of U6-sgRNA-tdTomato. (C) An overview of sgRNA target sites at the murine Trp53 locus. dNC, distal negative control, based on their distant location from the TSS. pNC, proximal negative control, based on their relatively close location to the TSS. Green represents sgRNAs predicted to knockdown based on their location in the first exon, just downstream of the TSS. (D) Schematic overview of dCas9-mediated interruption of transcriptional elongation by RNA polymerase (RNAP). (E) A schematic overview of in vitro competition assays. (F) Normalized fold-enrichment of individual sgRNAs targeting different regions of the Trp53 locus after cisplatin treatment compared with RNAi (shRNA TRP53). No enrichment would lead to a normalized fold enrichment score of zero. **P < 0.01 between the two indicated conditions via Student’s t test. Data are represented as mean ± SEM. (G) A Western blot showing a time course of TRP53 and CDKN1A accumulation in Eμ-Myc p19Arf−/− lymphoma after cisplatin (Cis.) treatment in control cells and cells with TRP53 down-regulation by either dCas9-mediated transcriptional interference or RNAi. (H) qRT-PCR assessment of TRP53 and TRP53 target-gene levels after cisplatin treatment after interfering with TRP53 expression levels. **P < 0.01 via Student’s t test. Data are represented as mean ± SEM.
Fig. 2.
Fig. 2.
Transcriptional modulation by dCas9 can alter tumor progression and treatment response in vivo. (A) Schematic overview of in vivo lymphoma transplantation experiments into syngeneic C57BL/6J mice. (B) TRP53 mRNA levels as assessed by qRT-PCR in vitro and in vivo after dCas9-mediated transcriptional silencing. (C) Time to disease onset in the absence of treatment. Via log-rank test P < 0.0001 between both Gal4 vs. T2 and Gal4 vs. T3 (mouse numbers: dCas9 + sgGal4 n = 8, dCas9 + sgTrp53 T2 n = 12, dCas9 + sgTrp53 T3 n = 13). (D) Overall survival with and without silencing of TRP53 and with and without cisplatin treatment. Via log-rank test P < 0.01 between both Gal4 vs. T2 and Gal4 vs. T3 (mouse numbers: dCas9 + sgGal4 vehicle n = 6, dCas9 + sgGal4 cisplatin n = 5, dCas9 + sgTrp53 T2 vehicle n = 7, dCas9 + sgTrp53 T2 cisplatin, dCas9 + sgTrp53 T3 vehicle n = 6, dCas9 + sgTrp53 T3 cisplatin n = 7).
Fig. 3.
Fig. 3.
A fusion of dCas9 with the VP64 activation domain targeted to a genomic region upstream of the TSS of Mgmt mediates temozolomide resistance. Plasmid maps of MSCV-dCas9-VP64-GFP (A) and U6-sgRNA-tdTomato (B). (C) A schematic overview of genomic binding sites of sgRNAs targeting murine Mgmt upstream of the TSS. (D) A schematic showing dCas9-VP64-GFP producing transcriptional activation. (E) The fold up-regulation of MGMT mRNA by dCas9-VP64 and multiple sgRNAs normalized to Gal4 negative control assessed by qRT-PCR. Data are represented as mean ± SEM. (F) Western blot analysis showing MGMT protein expression after transcriptional activation with different sgRNAs (a.e., alternative exposure). (G) A schematic overview of MGMT’s enzymatic function. (H) A dose–response curve of B-ALL cells treated in vitro with or without transcriptional activation of Mgmt. LogIC50’s are significantly different at P < 0.001 by an extra sum-of-squares F test. (I) A schematic overview depicting in vivo transplantation of B-ALL cells into syngeneic immune-competent C57BL/6J mice. Kaplan–Meier curves with or without Mgmt induction and after vehicle (J) (P = 0.2682, log rank test) or TMZ treatment (K) (P = 0.0039, log rank test) (mouse numbers: dCas9 + sgGal4 vehicle n = 6, dCas9 + sgGal4 TMZ n = 6, dCas9 + sgMgmt-NT4 vehicle n = 7, dCas9 + sgMgmt-NT4 TMZ n = 6, dCas9 + sgMgmt-T6 vehicle n = 5, dCas9 + sgMgmt-T6 n = 6).
Fig. 4.
Fig. 4.
CRISPRi knockdown is specific with minimal off-target effects. (A) A schematic showing that exons 2–10 of Trp53 are lost after Cre-mediated recombination in KrasLSL-G12D/+; Trp53fl/fl (KP) murine lung adenocarcinoma cells allowing a binding of both T2 and T3 Trp53 sgRNAs without interfering with TRP53’s downstream effects. (B) Hierarchical clustering of KP cells stably transduced with dCas9 and either sgRNAs targeting Gal4 (nontargeting control), Trp53 T2 or Trp53 T3. Text is colored by replicate. MA plots of genome-wide RNAseq data with significantly differentially regulated transcripts highlighted in red (P < 0.01 after FDR adjustment) for Trp53 T2 vs. Gal4 (C), Trp53 T3 vs. Gal4 (D), and Trp53 T2 vs. Trp53 T3 (E).
Fig. 5.
Fig. 5.
The genomic binding region relative to the TSS determines gene activation or repression by dCas9. (A) A schematic overview showing dCas9-VP64 acting as either an activator or inhibitor of gene transcription. (B) TRP53 mRNA levels assessed by qRT-PCR in B-ALL cells transduced with either dCas9 or dCas9-VP64 and sgRNAs targeting Gal4 (negative control), Trp53 T2, or Mgmt T6. Data are represented as mean ± SEM. (C) mRNA levels assessed by qRT-PCR in B-ALL cells transduced with dCas9-VP64 and sgRNAs targeting genomic regions downstream of the TSS. Data are represented as mean ± SEM. (D) Dose–response curves of B-ALL cells transduced with dCas9 or dCas9-VP64 and sgRNAs Gal4, Trp53 T3, or Mgmt T6 doses with cisplatin. For both dCas9 and dCas9-VP64, logIC50’s are significantly different at P < 0.0001 by an extra sum-of-squares F test. (E) Dose–response curves of B-ALL cells transduced with dCas9 or dCas9-VP64 and sgRNAs Gal4, Trp53 T3, or Mgmt T6 doses with TMZ. For both dCas9 and dCas9-VP64, logIC50’s are significantly different at P < 0.01 by an extra sum-of-squares F test.
Fig. 6.
Fig. 6.
Parallel in vitro and in vivo dCas9-VP64–mediated gene activation screens for mediators of leukemia treatment relapse reveal opposing effects of MGMT and CHEK2 on temozolomide sensitivity. (A) A diagram of the in vitro and in vivo screening strategies. (B) A graph showing the number of unique sgRNAs detected in in vitro and in vivo samples. In vitro (C) and in vivo (D) log10 fold-change plots showing sgRNA representation after treatment. sgRNAs of statistically significant genes are shown in color. (E) Overall survival without treatment with and without Chek2 transcriptional activation. Via log-rank test, P < 0.0001 between both VP64 vs. Chek2-2 and VP64 vs. Chek2-5. (F) Overall survival after TMZ treatment with and without Chek2 transcriptional activation. Via log rank test, P < 0.0001 between both VP64 vs. Chek2-2 and VP64 vs. Chek2-5 (mouse numbers: dCas9 + sgGal4 vehicle n = 10, dCas9 + sgGal4 TMZ n = 10, dCas9 + sgChek2-2 vehicle n = 10, dCas9 + sgChek2-2 TMZ n = 10, dCas9 + sgChek2-5 vehicle n = 10, dCas9 + sgChek2-5 n = 10).

References

    1. Pettersson E, Lundeberg J, Ahmadian A. Generations of sequencing technologies. Genomics. 2009;93(2):105–111. - PubMed
    1. Alexandrov LB, et al. Australian Pancreatic Cancer Genome Initiative; ICGC Breast Cancer Consortium; ICGC MMML-Seq Consortium; ICGC PedBrain Signatures of mutational processes in human cancer. Nature. 2013;500(7463):415–421. - PMC - PubMed
    1. Lawrence MS, et al. Mutational heterogeneity in cancer and the search for new cancer-associated genes. Nature. 2013;499(7457):214–218. - PMC - PubMed
    1. Roberts SA, Gordenin DA. Hypermutation in human cancer genomes: Footprints and mechanisms. Nat Rev Cancer. 2014;14(12):786–800. - PMC - PubMed
    1. Carroll D. Genome engineering with zinc-finger nucleases. Genetics. 2011;188(4):773–782. - PMC - PubMed

Publication types