

PET-measured longitudinal flow gradient correlates with invasive fractional flow reserve in CAD patients
- PMID: 27325812
- PMCID: PMC6279108
- DOI: 10.1093/ehjci/jew116
PET-measured longitudinal flow gradient correlates with invasive fractional flow reserve in CAD patients
Abstract
Aims: We aimed to evaluate whether a PET-determined longitudinal decrease in myocardial blood flow (MBF) or gradient, assumed as a more specific flow parameter for epicardial resistance, correlates with invasively measured fractional flow reserve (FFR) in coronary artery disease (CAD) patients.
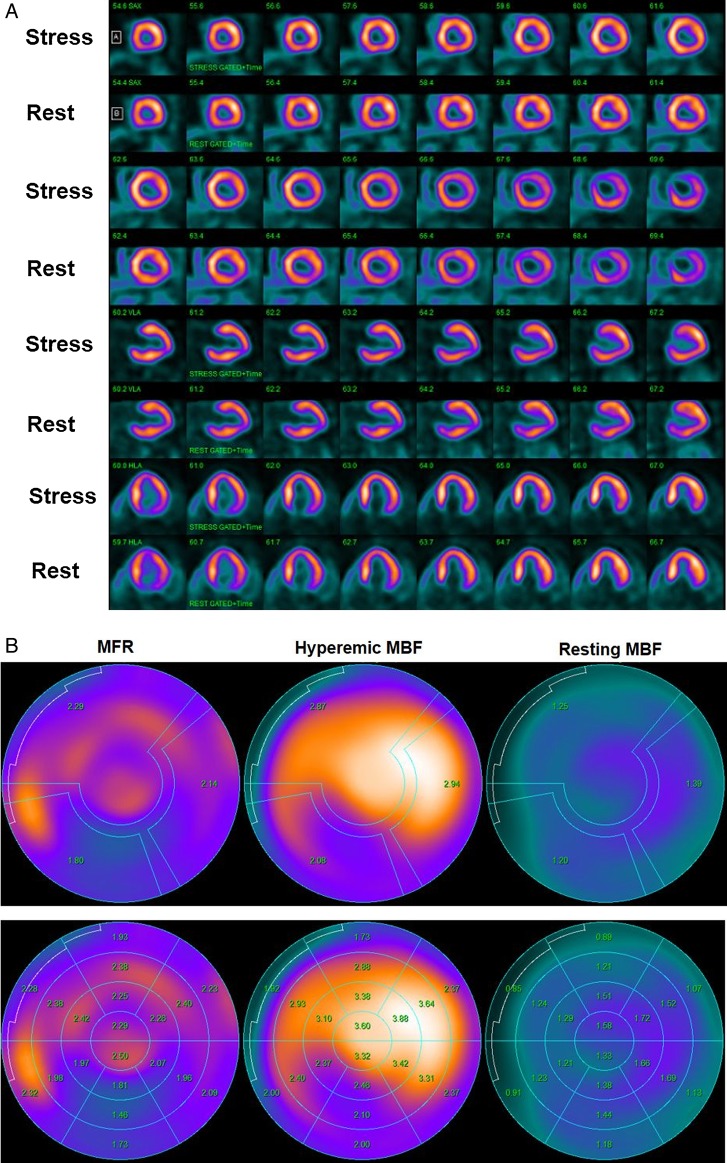
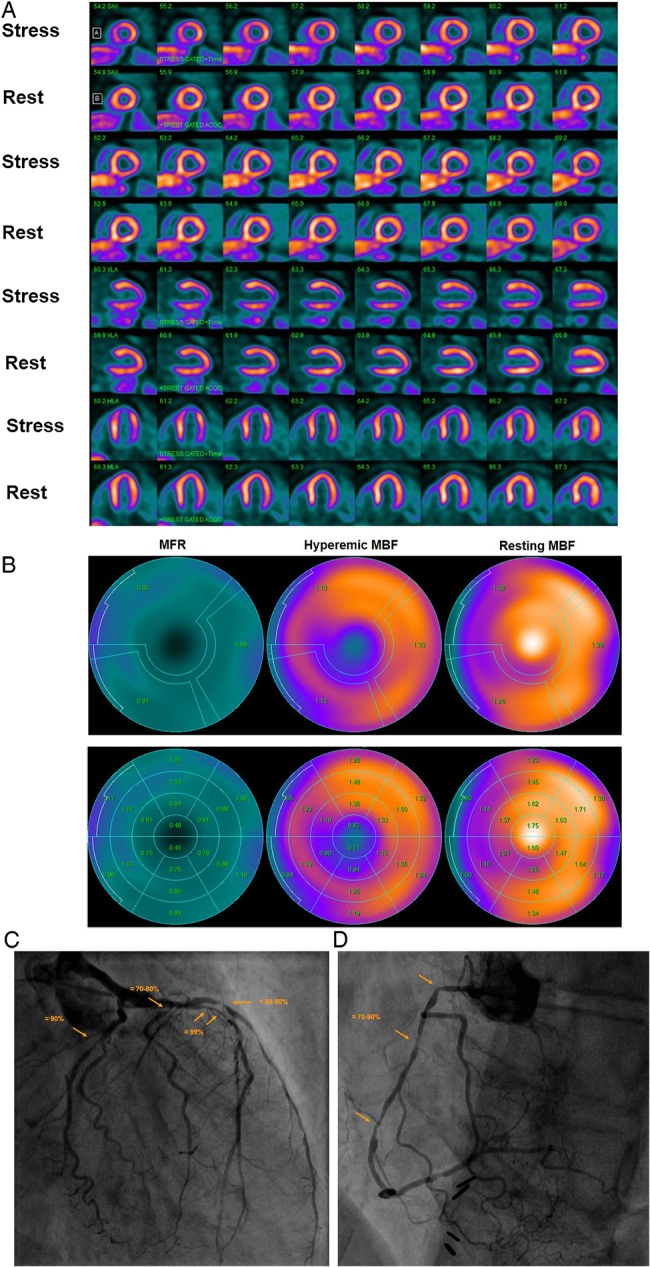
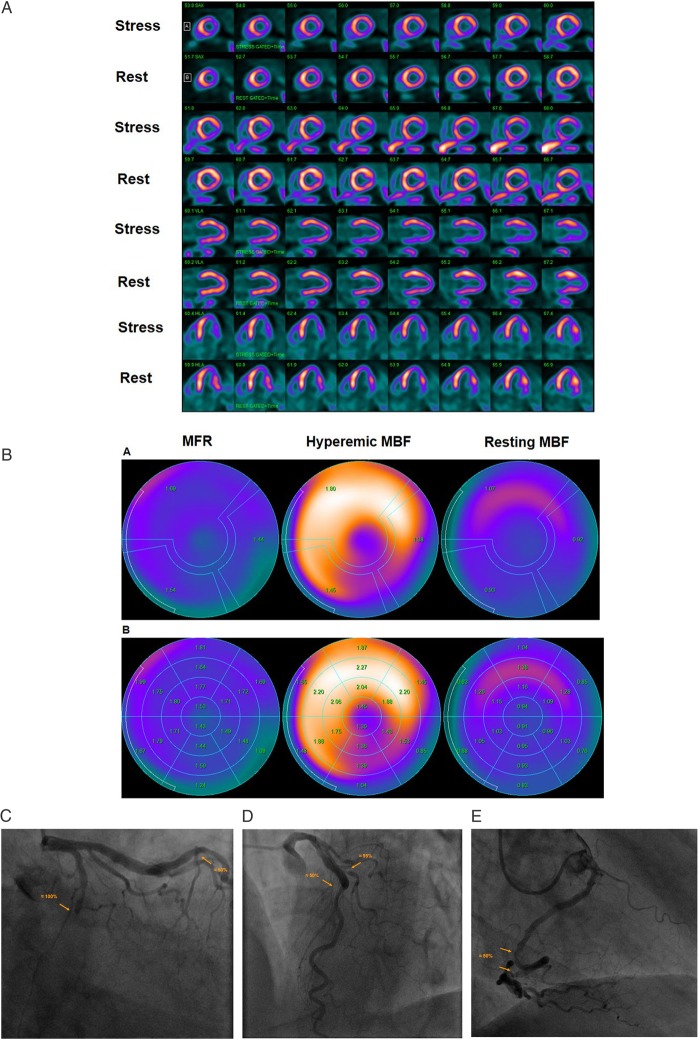
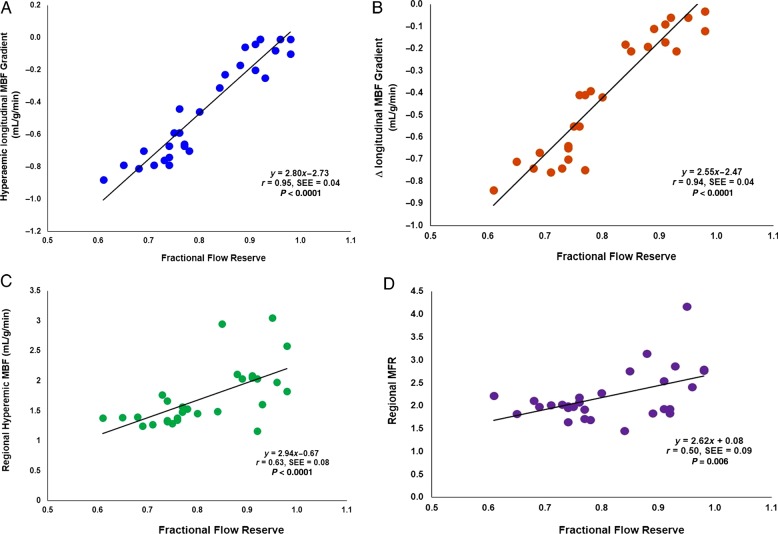
Methods and results: In 29 patients with suspected or known CAD, myocardial perfusion and MBF in mL/g/min was determined with 13N-ammonia PET/CT during regadenoson stimulation and at rest, and corresponding myocardial flow reserve (MFR = MBF stress/MBF rest) was calculated. MBF parameters were assessed in the myocardial region with stress-related perfusion defect and with stenosis ≥50% (Region 1), without defect but with stenosis ≥50% (Region 2), or without stenosis ≥50% (Region 3). Hyperaemic MBFs were significantly lower in the mid-distal than in the mid-left ventricular myocardium in Regions 1-3 [median and IQ range: 1.57 (1.24, 1.84) vs. 1.87 (1.61, 2.00), and 1.23 (1.11, 1.86) vs. 1.89 (1.80, 1.97), and 1.78 (1.48, 2.00) vs. 1.94 (1.84, 2.05) mL/g/min, P < 0.0001]. Resulting longitudinal MBF gradient during hyperaemic flows was more pronounced in Region 2 than in Regions 1 and 3, respectively [-0.46 (-0.70, -0.10) vs. -0.17 (-0.29, -0.11) and -0.15 (-0.25, -0.09) mL/g/min, respectively, P < 0.01]. There was a significant correlation between the hyperaemic longitudinal MBF gradient and FFR (r = 0.95; P < 0.0001), while this association was less pronounced for corresponding MFR (r = 0.50; P = 0.006).
Conclusion: The observed close correlation between a longitudinal MBF gradient during hyperaemic flows and invasively measured FFR suggests the longitudinal flow gradient as an emerging non-invasive index of flow-limiting CAD.
Keywords: CAD; PET; circulation; coronary stenosis; flow gradient; microvascular function; myocardial blood flow; myocardial flow reserve; myocardial perfusion.
Published on behalf of the European Society of Cardiology. All rights reserved. © The Author 2016. For permissions please email: journals.permissions@oup.com
Figures
Similar articles
-
Diagnostic value of PET-measured longitudinal flow gradient for the identification of coronary artery disease.JACC Cardiovasc Imaging. 2014 Apr;7(4):387-96. doi: 10.1016/j.jcmg.2014.01.001. Epub 2014 Mar 13. JACC Cardiovasc Imaging. 2014. PMID: 24631507
-
Diagnostic value of longitudinal flow gradient for the presence of haemodynamically significant coronary artery disease.Eur Heart J Cardiovasc Imaging. 2019 Jan 1;20(1):21-30. doi: 10.1093/ehjci/jey129. Eur Heart J Cardiovasc Imaging. 2019. PMID: 30212851
-
Computed tomography myocardial perfusion vs 15O-water positron emission tomography and fractional flow reserve.Eur Radiol. 2017 Mar;27(3):1114-1124. doi: 10.1007/s00330-016-4404-5. Epub 2016 Jun 22. Eur Radiol. 2017. PMID: 27334015 Free PMC article.
-
Longitudinal myocardial blood flow gradient and CAD detection.Curr Cardiol Rep. 2015 Jan;17(1):550. doi: 10.1007/s11886-014-0550-z. Curr Cardiol Rep. 2015. PMID: 25417123 Review.
-
Cardiac PET imaging for the detection and monitoring of coronary artery disease and microvascular health.JACC Cardiovasc Imaging. 2010 Jun;3(6):623-40. doi: 10.1016/j.jcmg.2010.04.007. JACC Cardiovasc Imaging. 2010. PMID: 20541718 Review.
Cited by
-
Updates on Stress Imaging Testing and Myocardial Viability With Advanced Imaging Modalities.Curr Treat Options Cardiovasc Med. 2017 Apr;19(4):26. doi: 10.1007/s11936-017-0525-7. Curr Treat Options Cardiovasc Med. 2017. PMID: 28316034 Free PMC article. Review.
-
Improved Performance of PET Myocardial Perfusion Imaging Compared to SPECT in the Evaluation of Suspected CAD.Curr Cardiol Rep. 2023 Apr;25(4):281-293. doi: 10.1007/s11886-023-01851-4. Epub 2023 Feb 24. Curr Cardiol Rep. 2023. PMID: 36826689 Review.
-
Myocardial blood flow reference values for 13N-ammonia PET myocardial perfusion imaging in patients without flow-limiting coronary artery disease.Eur J Nucl Med Mol Imaging. 2025 Jul;52(9):3353-3363. doi: 10.1007/s00259-025-07196-0. Epub 2025 Mar 14. Eur J Nucl Med Mol Imaging. 2025. PMID: 40082264 Free PMC article.
-
Systolic blood pressure ≤110 mm Hg is associated with severe coronary microvascular ischemia and higher risk for ventricular arrhythmias in hypertrophic cardiomyopathy.Heart Rhythm O2. 2023 Aug 4;4(9):538-548. doi: 10.1016/j.hroo.2023.07.009. eCollection 2023 Sep. Heart Rhythm O2. 2023. PMID: 37744936 Free PMC article.
-
Myocardial perfusion imaging: Lessons learned and work to be done-update.J Nucl Cardiol. 2018 Feb;25(1):39-52. doi: 10.1007/s12350-017-1093-7. Epub 2017 Nov 6. J Nucl Cardiol. 2018. PMID: 29110288 Review.
References
-
- Valenta I, Quercioli A, Schindler TH. Diagnostic value of PET-measured longitudinal flow gradient for the identification of coronary artery disease. JACC Cardiovasc Imaging 2014;7:387–96. - PubMed
-
- Schindler TH. Positron-emitting myocardial blood flow tracers and clinical potential. Prog Cardiovasc Dis 2015;57:588–606. - PubMed
-
- Schindler TH, Schelbert HR, Quercioli A, Dilsizian V. Cardiac PET imaging for the detection and monitoring of coronary artery disease and microvascular health. JACC Cardiovasc Imaging 2010;3:623–40. - PubMed
-
- Schindler TH, Dilsizian V. PET-determined hyperemic myocardial blood flow: further progress to clinical application. J Am Coll Cardiol 2014;64:1476–8. - PubMed
-
- Bengel FM. Leaving relativity behind: quantitative clinical perfusion imaging. J Am Coll Cardiol 2011;58:749–51. - PubMed
Publication types
MeSH terms
Grants and funding
LinkOut - more resources
Full Text Sources
Other Literature Sources
Medical
Miscellaneous
