Clinical Trial
. 2016 Jun 27;213(7):1163-74.
doi: 10.1084/jem.20151529. Epub 2016 Jun 20.

Human USP18 deficiency underlies type 1 interferonopathy leading to severe pseudo-TORCH syndrome

Affiliations
Clinical Trial

Human USP18 deficiency underlies type 1 interferonopathy leading to severe pseudo-TORCH syndrome

Marije E C Meuwissen et al. J Exp Med. .

Abstract

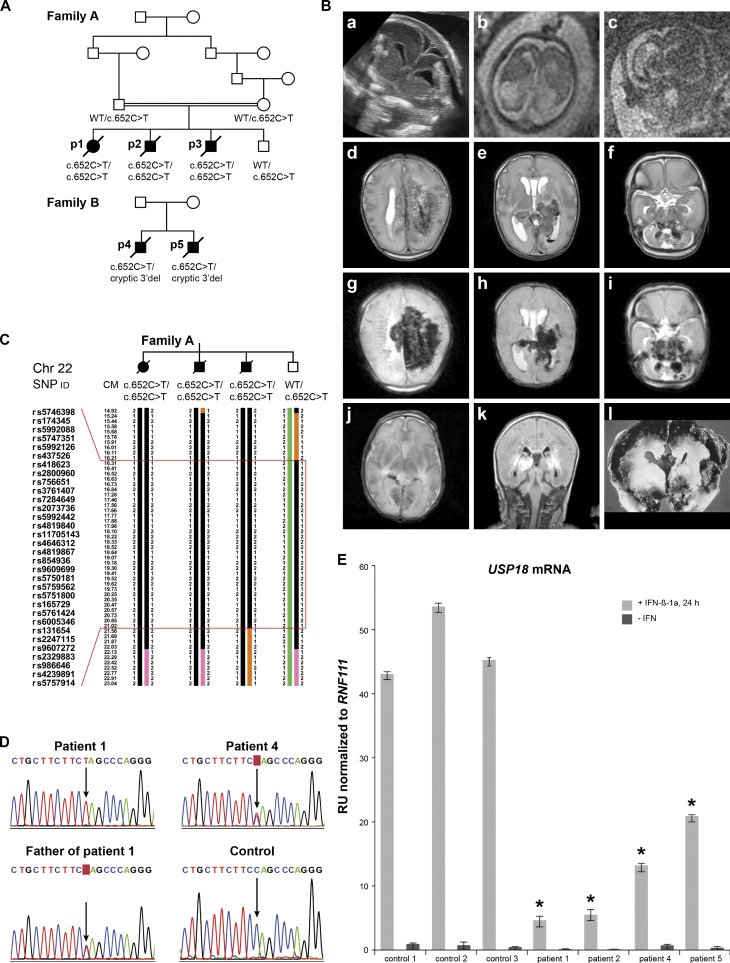
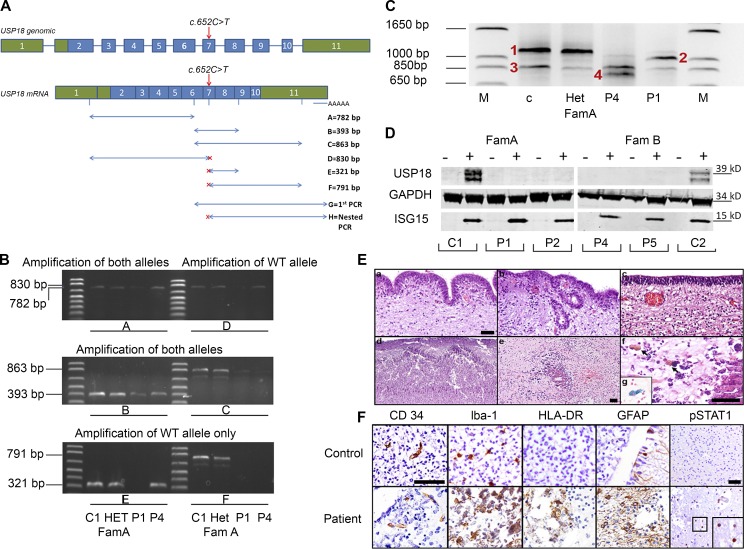
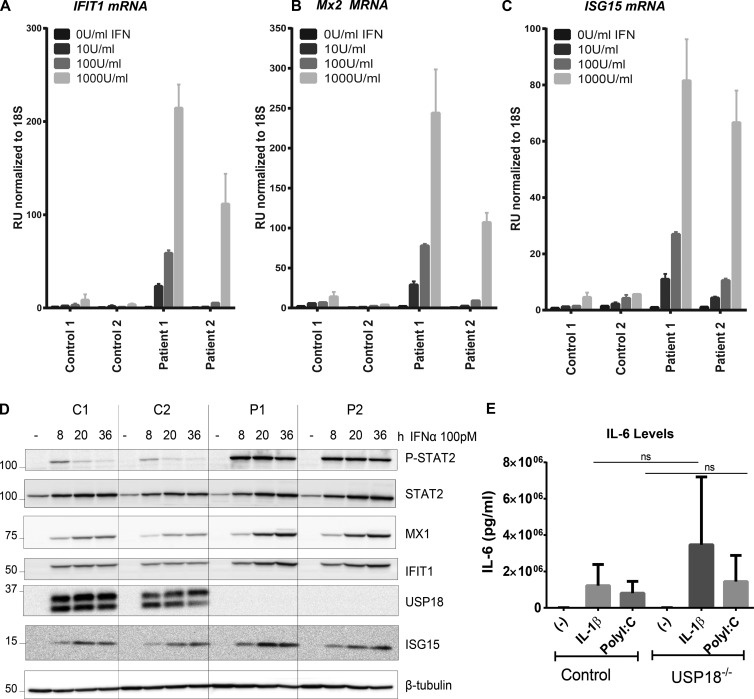
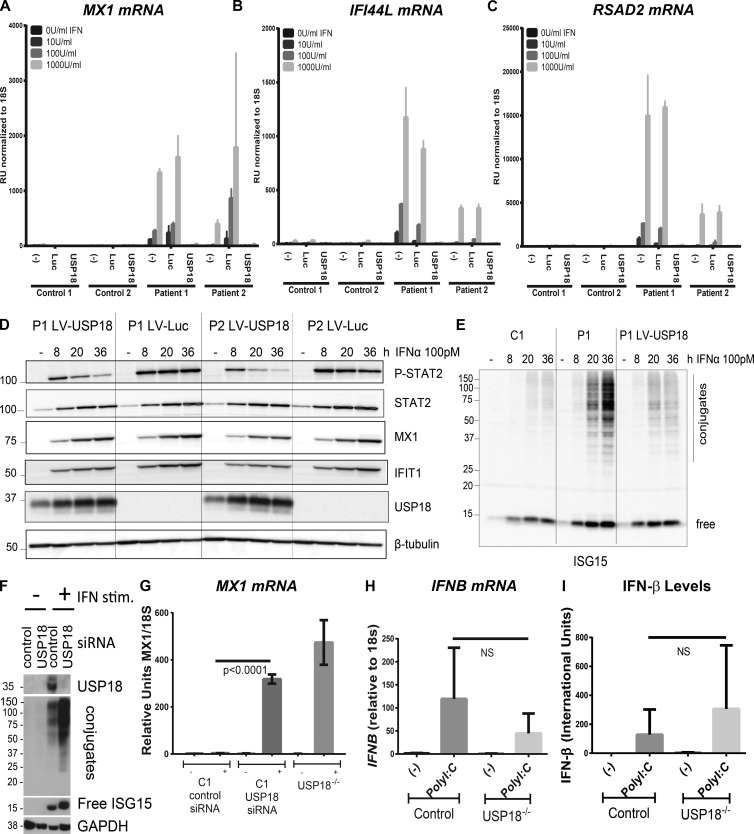
Pseudo-TORCH syndrome (PTS) is characterized by microcephaly, enlarged ventricles, cerebral calcification, and, occasionally, by systemic features at birth resembling the sequelae of congenital infection but in the absence of an infectious agent. Genetic defects resulting in activation of type 1 interferon (IFN) responses have been documented to cause Aicardi-Goutières syndrome, which is a cause of PTS. Ubiquitin-specific peptidase 18 (USP18) is a key negative regulator of type I IFN signaling. In this study, we identified loss-of-function recessive mutations of USP18 in five PTS patients from two unrelated families. Ex vivo brain autopsy material demonstrated innate immune inflammation with calcification and polymicrogyria. In vitro, patient fibroblasts displayed severely enhanced IFN-induced inflammation, which was completely rescued by lentiviral transduction of USP18. These findings add USP18 deficiency to the list of genetic disorders collectively termed type I interferonopathies. Moreover, USP18 deficiency represents the first genetic disorder of PTS caused by dysregulation of the response to type I IFNs. Therapeutically, this places USP18 as a promising target not only for genetic but also acquired IFN-mediated CNS disorders.


Figures

Figure 1.
Figure 1.
Pedigrees, brain imaging, genomic, and expression data. (A) Pedigrees of family A and B (p1, p2, p3, p4, and p5 indicate P1–P5). Family A includes three affected siblings (P1, P2, and P3) and one unaffected (heterozygote) sibling; family B includes two affected siblings (P4 and P5). The corresponding genotypes are indicated. (B) Prenatal ultrasound (22nd gestational week; a) and fetal MRI (b and c) for P1, showing ventriculomegaly with irregular ventricle linings, parenchymal lesions, and cortical destruction. (d–k) Postnatal MRI; d, e, and f (T2-weighted images) and g, h, and i (susceptibility-weighted images) concern P2, and show extensive parenchymal, basal ganglial, and cerebellar hemorrhages. j (T2 weighted) and k (FLAIR) are images of P3, showing bilateral thalamic hemorrhage and white matter hyperintensities. i depicts a postmortem brain analysis for P4, with massive hemorrhagic destruction. (C) Haplotype analysis of the linkage area on chromosome 22q in family A, including SNP IDs and location on the chromosome in centimorgans (CM). The region between the red lines is homozygous in the three affected individuals and heterozygous in the unaffected sibling. (D) Electropherograms of DNA sequencing reactions, showing the USP18 homozygote c.652C>T, p.Q218X mutation in P1, the heterozygous mutation in his father (identical to that of the mother and the healthy brother) and in P4 of family B, and the WT sequence of a healthy control (each repeated twice). (E) USP18 expression before and after 24-h stimulation with IFN-β-1a in cultured fibroblasts from P1 and P2 (family A), P4 and P5 (family B), and three healthy controls (C1, C2, and C3) tested by quantitative RT-PCR using primers amplifying exon 4–6 of USP18 (for primer sequences see Table S4) and normalized against the housekeeping gene RNF111. One unstimulated control is set as 1.0 on the y-axis, which allows fold-change comparison. Error bars, SD. RU, relative units. Cumulative data of two independent experiments under identical conditions. *, P < 0.05, unpaired Student’s t test for each patient sample versus three controls.
Figure 2.
Figure 2.
USP18 transcripts, protein, and brain pathology. (A) Schematic of the genomic DNA and mRNA USP18, with coding regions in blue, UTRs in green, and the c.652C>T mutation indicated by the red arrow. RT-PCR primer locations and expected product sizes are shown from A to F in the key, and G and H refer to 3′ RACE and nested PCR primers, covering exon 1 to the poly-A tail. PCR primers designed to amplify only the c.652C WT allele are indicated by a red x. (B) RT-PCR amplicons obtained using the primer sets schematized in A. C1, control; Het-FamA, healthy heterozygote sibling from family A; P1, P1 from family A; P4, P4 from family B. Primers used are listed in Table S4. (C) Nested PCR products of the 3′ RACE cDNA amplification (area indicated in A, primer sets G and H). The four bands obtained in C1, P1, P4, and Het-FamA samples, indicated by red numbers, were subjected to capillary sequencing: band 1 (∼1,200 bp), band 2 (∼1,000 bp), band 3 (∼850 bp), and band 4 (∼800 bp). Both RT-PCR and 3′ RACE experiments were separately repeated three times with identical results. (D) Western blot analysis of the endogenous USP18 protein in cultured fibroblasts from controls and from P1, P2, P4, and P5, before and after stimulation for 24 h with IFN-β-1a. Levels of the IFN-inducible ISG15 protein and of GADPH as control were also measured. In control cells, IFN-induced USP18 and ISG15 were detected after IFNβ-1a treatment. In patients cells, no USP18 protein was detected. This experiment has been replicated twice with separate controls and with identical results. (E) H&E staining of autopsy brain material from P1. Irregular ependyme with a curvilinear shape, columnar arrangement (a), and numerous ependymal canals (b) are present, compared with an age-matched control case (c).Trajectories of polymicrogyria (d). Vessel-associated dystrophic calcifications in the white matter (e). (f) Magnification of e: with arrows showing hemosiderophages. (g) Prussian blue staining for iron. Bars: 50 µm (a and f), 100 µm (e); magnification in b and c is equal to a; magnification in d is equal to e. (F) P1 and age-matched control brain material. Immunohistochemistry for vessels (CD34) and for the presence of innate immune response activation in the white matter, using markers for the microglial ionized calcium-binding adaptor molecule 1 (Iba-1), MHC class II (HLA-DR), and the astrocyte marker glial fibrillary acidic protein (GFAP). pSTAT1 is used as marker for type I IFN response activation (inset showing a magnification of positive cells in the patient). Bars: (CD34 control) 50 µm (magnification in CD34, Iba-1, HLA-DR, and GFAP are equal to CD34 control); (pSTAT1 control) 50 µM (magnification in the patient is the same as in the control).
Figure 3.
Figure 3.
mRNA and protein expression of USP18 and ISGs, as assessed by qRT-PCR and Western blotting after IFN treatment, and IL-6 production assessment. (A–C) Primary fibroblasts from C1 and C2 and from P1 and 2 were treated with the indicated doses of IFN-α2b for 12 h, washed with PBS, and left to rest for 36 h, after which relative mRNA levels were assessed for the genes indicated, with representative experiment of three with SD shown. (D) Primary fibroblasts from two controls (C1 and C2) and P1 and P2 were stimulated with 100 pM IFN-α2 for 8, 20, and 36 h. The levels of phosphorylated STAT2 and of the indicated ISG products were analyzed by Western blotting of 20 µg of cell lysate, representative experiment of two shown. RU, relative units. IL-6 production at 24 h after stimulation with 10 ng/ml IL-1B or 25 µg/ml Poly(I:C) was measured using ELISA. Shown are pooled data from two independent experiments, each done in duplicates using three different controls and two patient cell lines. Mann-Whitney test was used for statistical analyses, with SEM shown (E).
Figure 4.
Figure 4.
WT USP18 allele rescues USP18 deficiency. Primary fibroblasts from C1 and C2 and from P1 and P2 were mock-transduced or transduced with luciferase-RFP or WT USP18, sorted, and treated with the indicated doses of IFN-α2b for 12 h, washed with PBS, and left to rest for 36 h, after which relative mRNA levels were assessed for the genes indicated (A–C) performed three times each with technical triplicates, representative experiment with SD shown. The levels of the indicated proteins were compared in fibroblasts from P1 and P2, transduced with USP18 or with the control Luc LV. Cells were stimulated and processed as in Fig. 3 D, representative experiment of two shown (D). The levels of free and conjugated ISG15 were analyzed in lysates (40 µg/lane) from a control (C1), P1 (P1), and USP18-transduced fibroblasts from P1 (P1 LV-USP18), stimulated, and processed as described in Fig. 3 D, representative experiment of two are shown (E). Primary fibroblasts from C1 were transfected with either control siRNA or siRNA targeting USP18, followed by vehicle of IFN stimulation for 36 h, when USP18, GAPDH, free, and conjugated ISG15 were analyzed in lysates, representative of two experiments shown (F), or were primed or not for 12 h with 1,000 IU IFN along with P1 USP18−/− cells, followed by 36 h rest when MX1 mRNA levels were assessed, representative of two experiments shown, performed in biological duplicates and technical triplicates. Student’s t test was used for statistical analyses with SEM (G). IFNB mRNA expression was measured after a 4-h stimulation with 25 µg/ml Poly (I:C), as well as IFN-β production at 24 h, both in control and patient cells. Two control and patient cell lines, in triplicates in two independent experiments were used for mRNA measurements; three control and two patient cell lines, in triplicates in three independent experiments were used for IFN-β measurement. Mann-Whitney test was used for statistical analyses with SEM shown (H and I).

References

    1. Bale J.F., Jr 2009. Fetal infections and brain development. Clin. Perinatol. 36:639–653. 10.1016/j.clp.2009.06.005 - DOI - PubMed
    1. Bonthius D.J. 2012. Lymphocytic choriomeningitis virus: an underrecognized cause of neurologic disease in the fetus, child, and adult. Semin. Pediatr. Neurol. 19:89–95. 10.1016/j.spen.2012.02.002 - DOI - PMC - PubMed
    1. Brouwer R.W., van den Hout M.C., Grosveld F.G., and van Ijcken W.F.. 2012. NARWHAL, a primary analysis pipeline for NGS data. Bioinformatics. 28:284–285. 10.1093/bioinformatics/btr613 - DOI - PubMed
    1. Bustin S.A., Benes V., Garson J.A., Hellemans J., Huggett J., Kubista M., Mueller R., Nolan T., Pfaffl M.W., Shipley G.L., et al. 2009. The MIQE guidelines: minimum information for publication of quantitative real-time PCR experiments. Clin. Chem. 55:611–622. 10.1373/clinchem.2008.112797 - DOI - PubMed
    1. Crow Y.J. 2015. Type I interferonopathies: mendelian type I interferon up-regulation. Curr. Opin. Immunol. 32:7–12. 10.1016/j.coi.2014.10.005 - DOI - PubMed

Publication types

MeSH terms

Supplementary concepts