. 2016 Mar;10(1):32-53.
doi: 10.1214/15-AOAS849. Epub 2016 Mar 25.

Sequential advantage selection for optimal treatment regime

Affiliations

Sequential advantage selection for optimal treatment regime

Ailin Fan et al. Ann Appl Stat. 2016 Mar.

Abstract

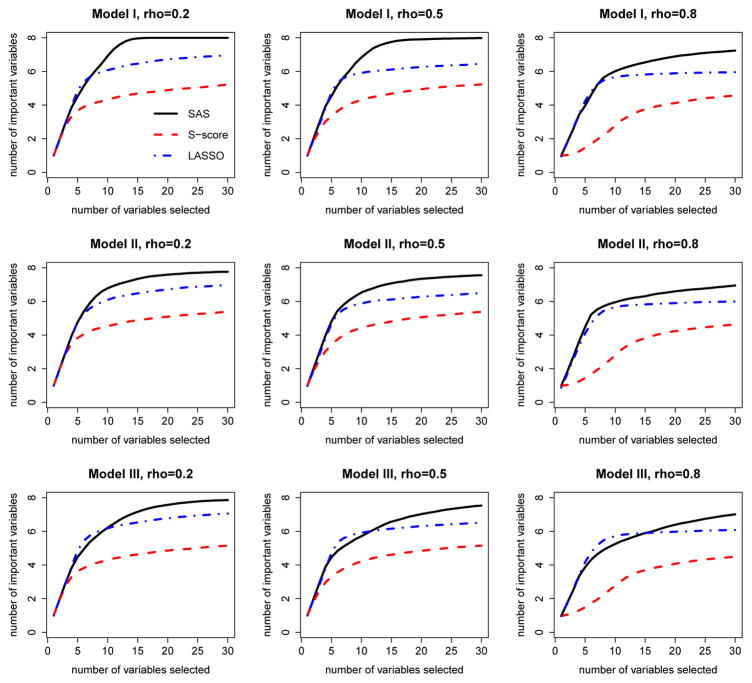
Variable selection for optimal treatment regime in a clinical trial or an observational study is getting more attention. Most existing variable selection techniques focused on selecting variables that are important for prediction, therefore some variables that are poor in prediction but are critical for decision-making may be ignored. A qualitative interaction of a variable with treatment arises when treatment effect changes direction as the value of this variable varies. The qualitative interaction indicates the importance of this variable for decision-making. Gunter, Zhu and Murphy (2011) proposed S-score which characterizes the magnitude of qualitative interaction of each variable with treatment individually. In this article, we developed a sequential advantage selection method based on the modified S-score. Our method selects qualitatively interacted variables sequentially, and hence excludes marginally important but jointly unimportant variables or vice versa. The optimal treatment regime based on variables selected via joint model is more comprehensive and reliable. With the proposed stopping criteria, our method can handle a large amount of covariates even if sample size is small. Simulation results show our method performs well in practical settings. We further applied our method to data from a clinical trial for depression.

Keywords: optimal treatment regime; qualitative interaction; variable selection.


Figures

Fig. 1
Fig. 1
Illustration of qualitative interactions of the covariates X1, X9 and X10 with treatment A. These are marginal plots of response Y versus covariates X1, X9 and X10 (from top to bottom) in two di3erent treatment groups, treatment 1 and treatment 0 from one simulation based on model I and the first choice of β. Correlations between covariates are: ρ = 0.2 (left panel) and ρ = 0.8 (right panel). The fitted lines are from simple linear regression based on data from one treatment group. Black triangles and dashed lines are from treatment 1, and red circles and dotted lines are from treatment 0.
Fig 2
Fig 2
Solution path of sequential advantage selection (SAS), S-score and LASSO methods. These plots are from the randomized study with the first choice of β (three important prescriptive variables: X1, X9 and X10), and are given for all combinations of three baseline functions and three choices of correlations of covariates. Black solid line: SAS method; Red dashed line: S-score method; blue dot-dashed line: LASSO method.
Fig 3
Fig 3
Solution path of sequential advantage selection (SAS), S-score and LASSO methods. These plots are from the randomized study with the second choice of β (eight important prescriptive variables: X1, X9, X10, X20, X22, X30, X35 and X40), and are given for all combinations of three baseline functions and three choices of correlations of covariates. Black solid line: SAS method; Red dashed line: S-score method; blue dot-dashed line: LASSO method.
Fig 4
Fig 4
Solution path of sequential advantage selection (SAS), S-score and LASSO methods. These plots are from the observational study with the first choice of β (three important prescriptive variables: X1, X9 and X10), and are given for all combinations of three baseline functions and three choices of correlations of covariates. Black solid line: SAS method; Red dashed line: S-score method; blue dot-dashed line: LASSO method.
Fig 5
Fig 5
Solution path of sequential advantage selection (SAS), S-score and LASSO methods. These plots are from the observational study with the second choice of β (eight important prescriptive variables: X1, X9, X10, X20, X22, X30, X35 and X40), and are for all combinations of three baseline functions and three choices of correlations of covariates. Black solid line: SAS method; Red line: S-score method; blue dot-dashed line: LASSO method.

References

    1. Chakraborty B, Murphy S, Strecher V. Inference for non-regular parameters in optimal dynamic treatment regimes. Statistical methods in medical research. 2010;19:317–343. - PMC - PubMed
    1. Fava M, Rush AJ, Trivedi MH, Nierenberg AA, Thase ME, Sackeim HA, Quitkin FM, Wisniewski S, Lavori PW, Rosenbaum JF, et al. Background and rationale for the Sequenced Treatment Alternatives to Relieve Depression (STAR* D) study. Psychiatric Clinics of North America. 2003;26:457–494. - PubMed
    1. Gail M, Simon R. Testing for qualitative interactions between treatment effects and patient subsets. Biometrics. 1985:361–372. - PubMed
    1. Gunter L, Zhu J, Murphy S. Variable selection for qualitative interactions. Statistical methodology. 2011;8:42–55. - PMC - PubMed
    1. Lu W, Zhang HH, Zeng D. Variable selection for optimal treatment decision. Statistical methods in medical research. 2013;22:493–504. - PMC - PubMed

LinkOut - more resources