. 2016 Jun 21;11(6):e0157753.
doi: 10.1371/journal.pone.0157753. eCollection 2016.

OpenVigil FDA - Inspection of U.S. American Adverse Drug Events Pharmacovigilance Data and Novel Clinical Applications

Affiliations

OpenVigil FDA - Inspection of U.S. American Adverse Drug Events Pharmacovigilance Data and Novel Clinical Applications

Ruwen Böhm et al. PLoS One. .

Abstract

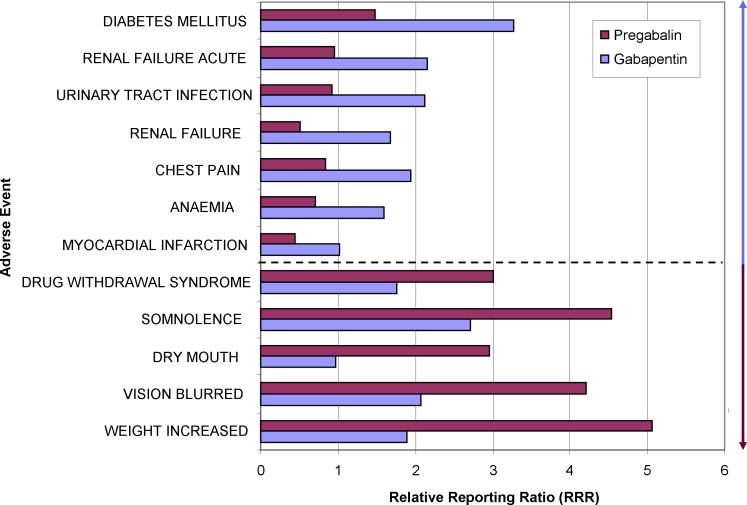
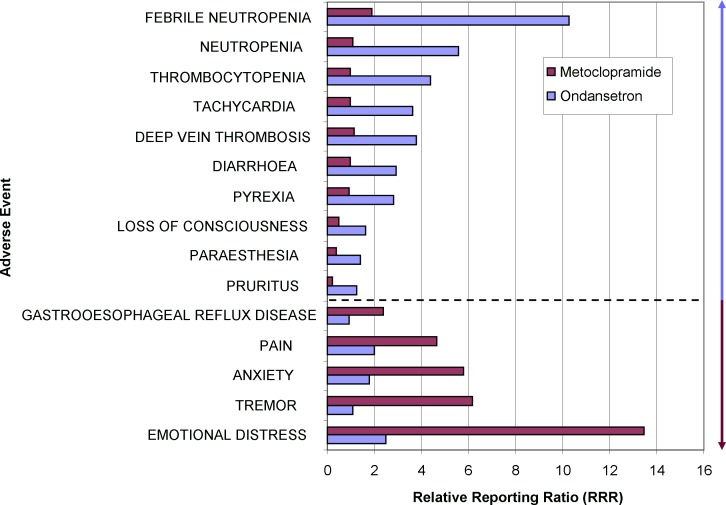
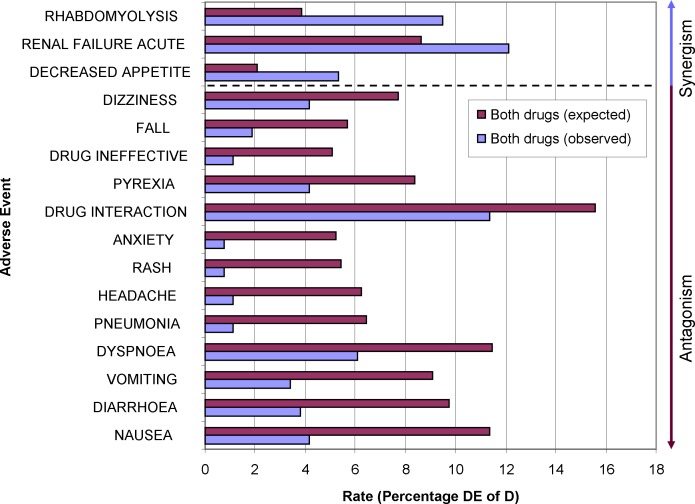
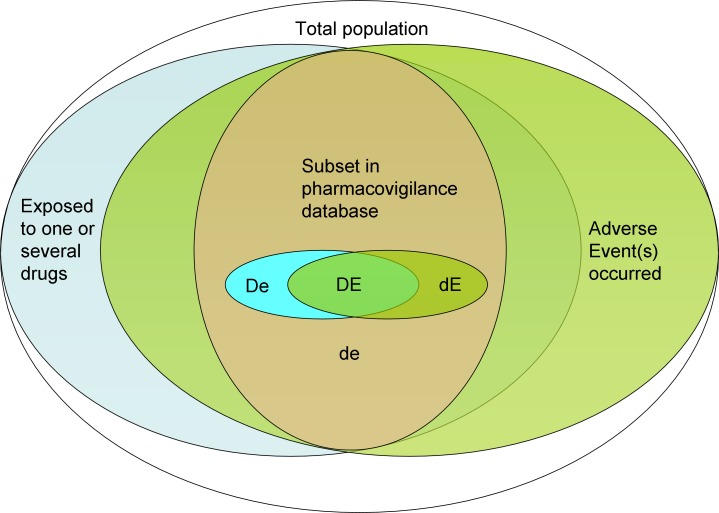
Pharmacovigilance contributes to health care. However, direct access to the underlying data for academic institutions and individual physicians or pharmacists is intricate, and easily employable analysis modes for everyday clinical situations are missing. This underlines the need for a tool to bring pharmacovigilance to the clinics. To address these issues, we have developed OpenVigil FDA, a novel web-based pharmacovigilance analysis tool which uses the openFDA online interface of the Food and Drug Administration (FDA) to access U.S. American and international pharmacovigilance data from the Adverse Event Reporting System (AERS). OpenVigil FDA provides disproportionality analyses to (i) identify the drug most likely evoking a new adverse event, (ii) compare two drugs concerning their safety profile, (iii) check arbitrary combinations of two drugs for unknown drug-drug interactions and (iv) enhance the relevance of results by identifying confounding factors and eliminating them using background correction. We present examples for these applications and discuss the promises and limits of pharmacovigilance, openFDA and OpenVigil FDA. OpenVigil FDA is the first public available tool to apply pharmacovigilance findings directly to real-life clinical problems. OpenVigil FDA does not require special licenses or statistical programs.


Conflict of interest statement

Competing Interests: The authors have declared that no competing interests exist.

Figures

Fig 1
Fig 1. 2x2 contingency table.
The letters “D”, “d”, “E” and “e” refer to the datasets involved: Capital D: drug was used, lowercase d: this drug was not used but other drugs, Capital E: event occurred, lowercase e: this event did not occur but other events. For more complex contingency tables, indices can be used to refer to a certain drug or event by name or numbering. Intersections of the datasets can be made by combining letters, e.g., DE is the subpopulation where the drug was used and the event occurred. More details see text and Table 3.
Fig 2
Fig 2. OpenVigil FDA: 2x2 disproportionality analysis (DPA) output.
The letters “D”, “d”, “E” and “e” refer to the datasets involved. Chisq (χYates2), RRR, PRR, ROR are measurements of disproportionality (calculations see text). Cf. the OpenVigil tutorials and caveat document how to interpret this interesting signal suggesting that an antidepressant causes depression. The signal is probably due to a mixture of wrong reporting (e.g., the field for event was used instead of the field for indication in the reporting form), drug failure (events "depression" + "drug ineffective") and a certain vulnerable subpopulation. Access date 2016-03-15.
Fig 3
Fig 3. Relative Reporting Ratios (RRR) of the adverse event “rash” for a given list of drugs.
A RRR value of 1 indicates the normal background noise, e.g., associations by chance. An increase of RRR indicates an overproportional association between the drug and the adverse event. RRR values much lower than 1 indicate a negative association, e.g., the usage of the drug protects the patient from the adverse event.
Fig 4
Fig 4. Comparative adverse event-profile of two tyrosine kinase inhibitors.
The largest relative differences in the RRRs of either nilotinib or imatinib are visualized for selected adverse events. The blue arrow indicates adverse events which are stronger associated with imatinib than nilotinib, the ruby arrow vice versa. Both groups are separated by the dotted line.
Fig 5
Fig 5. Comparative adverse event-profile of two drugs used for neuropathic pain, epileptic seizures and mood stabilization.
The largest relative differences in the RRRs of either gabapentin or pregabalin are visualized for selected adverse events. The blue arrow indicates adverse events which are stronger associated with gabapentin than pregabalin, the ruby arrow vice versa. Both groups are separated by the dotted line.
Fig 6
Fig 6. Comparative adverse event-profile of two antiemetic drugs.
The largest relative differences in the RRRs of either ondansetron or metoclopramide are visualized for selected adverse events. The blue arrow indicates adverse events which are stronger associated with ondansetron than metoclopramide, the ruby arrow vice versa. Both groups are separated by the dotted line.
Fig 7
Fig 7. Comparison of expected-observed rates for two drugs and their combination.
An observed rate that is greater than the expected rate suggests a synergistic interaction. Vice versa, an observed rate lower than expected suggests an antagonistic interaction.
Fig 8
Fig 8. The open-world problem in pharmacovigilance.
The numbers extractable from any adverse event database (DE, dE, De, de) come from a subset, i.e., all the reported cases. The rest of the population is unknown to the system.

References

    1. Iyer SV, Lependu P, Harpaz R, Bauer-Mehren A, Shah NH. Learning signals of adverse drug-drug interactions from the unstructured text of electronic health records. AMIA Summits Transl Sci Proc. 2013;2013:83–7. - PMC - PubMed
    1. Harpaz R, DuMouchel W, Shah NH, Madigan D, Ryan P, Friedman C. Novel data-mining methodologies for adverse drug event discovery and analysis. Clinical Pharmacology & Therapeutics. 2012;91(6):1010–21. - PMC - PubMed
    1. Pitts PJ. openFDA An Open Question. Therapeutic Innovation & Regulatory Science. 2015;49(2):254–5. - PubMed
    1. Böhm R, Höcker J, Cascorbi I, Herdegen T. OpenVigil—free eyeballs on AERS pharmacovigilance data. Nat Biotechnol. 2012;30(2):137–8. 10.1038/nbt.2113 - DOI - PubMed
    1. Hamamoto T, Serizawa A, Ohtsuki K, Kawakami J, Sato K. [Visualization and analysis of adverse reactions of molecularly targeted anticancer agents using the self-organizing map (SOM)]. Yakugaku Zasshi. 2014;134(10):1069–80. - PubMed

LinkOut - more resources