. 2016 Jun 21:7:11934.
doi: 10.1038/ncomms11934.

Early role of vascular dysregulation on late-onset Alzheimer's disease based on multifactorial data-driven analysis

Collaborators, Affiliations

Early role of vascular dysregulation on late-onset Alzheimer's disease based on multifactorial data-driven analysis

Y Iturria-Medina et al. Nat Commun. .

Abstract

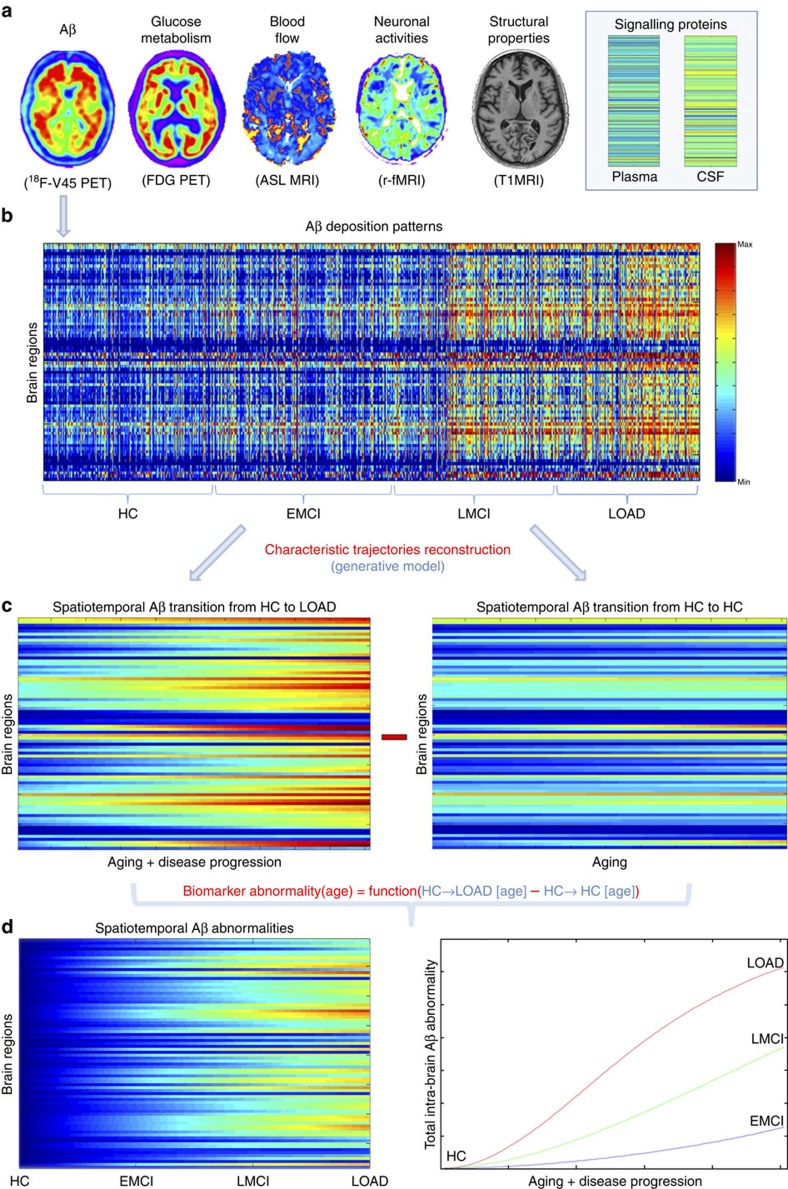
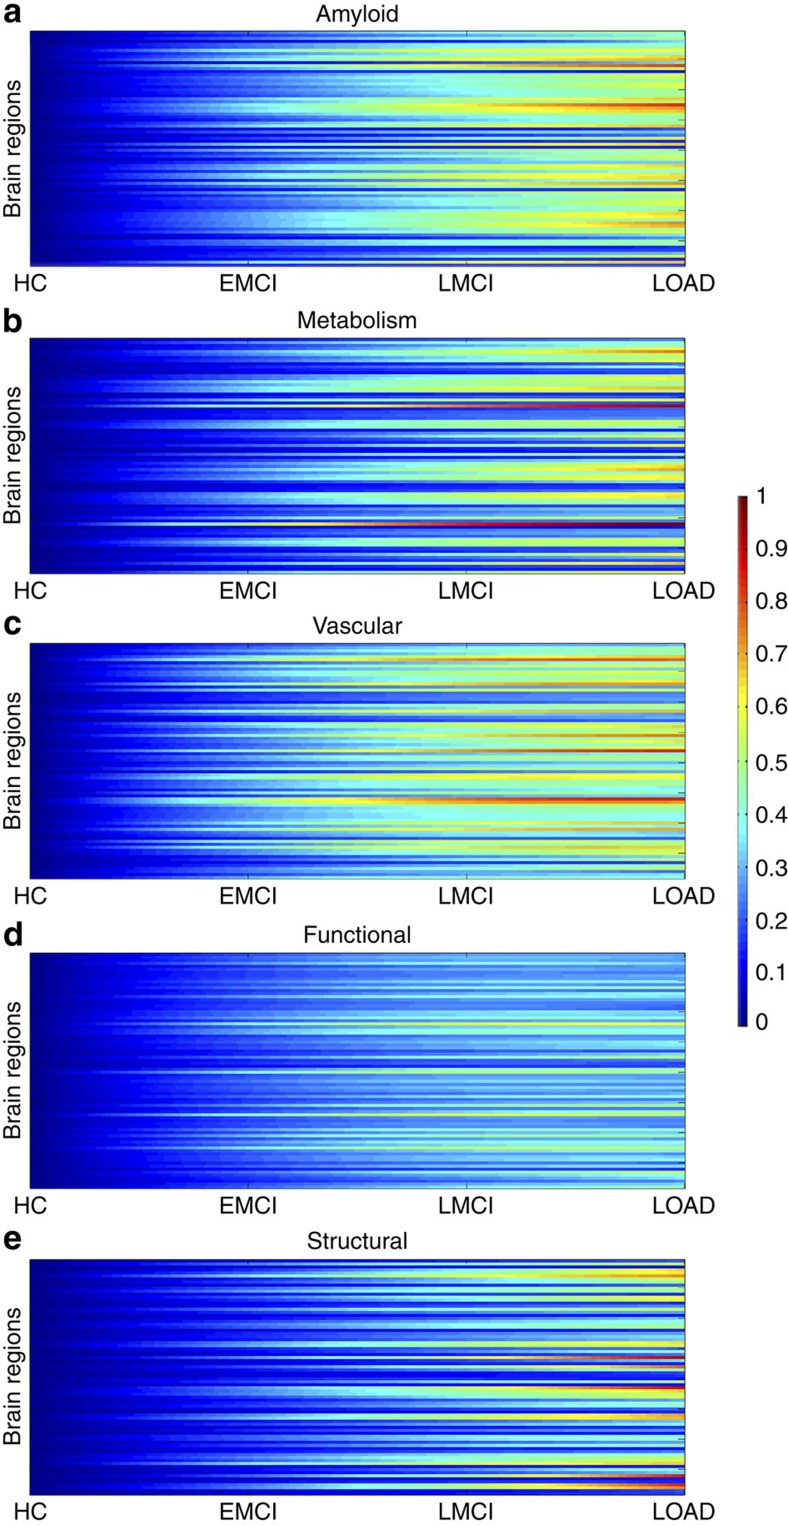
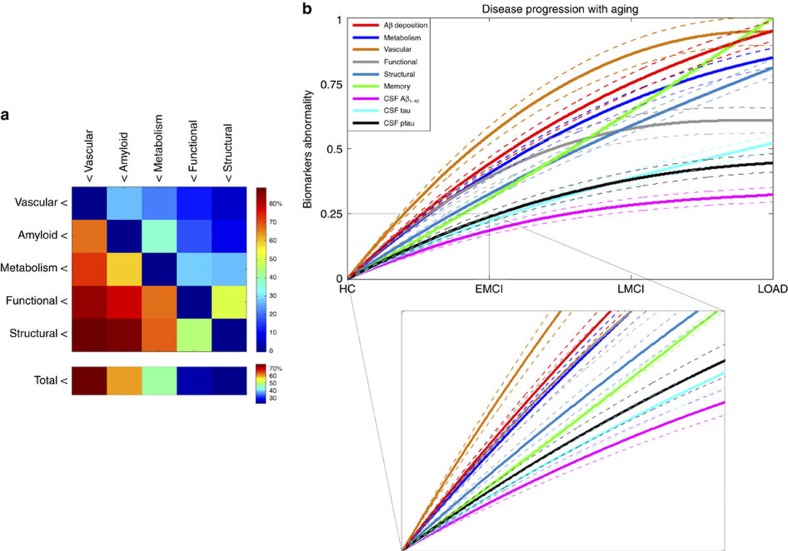
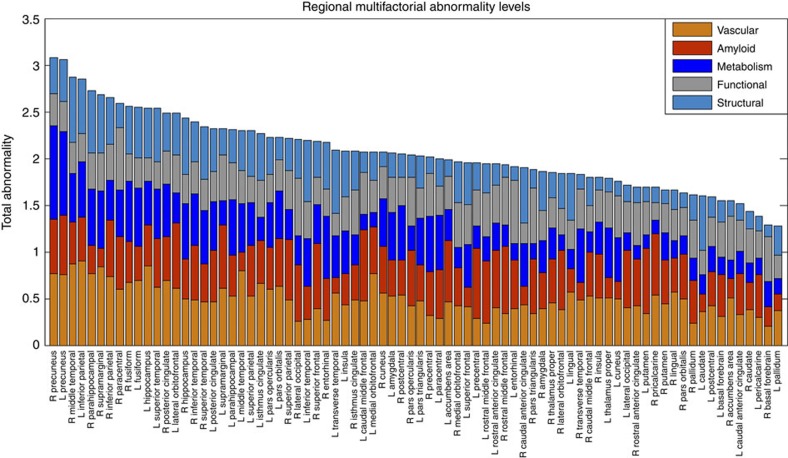
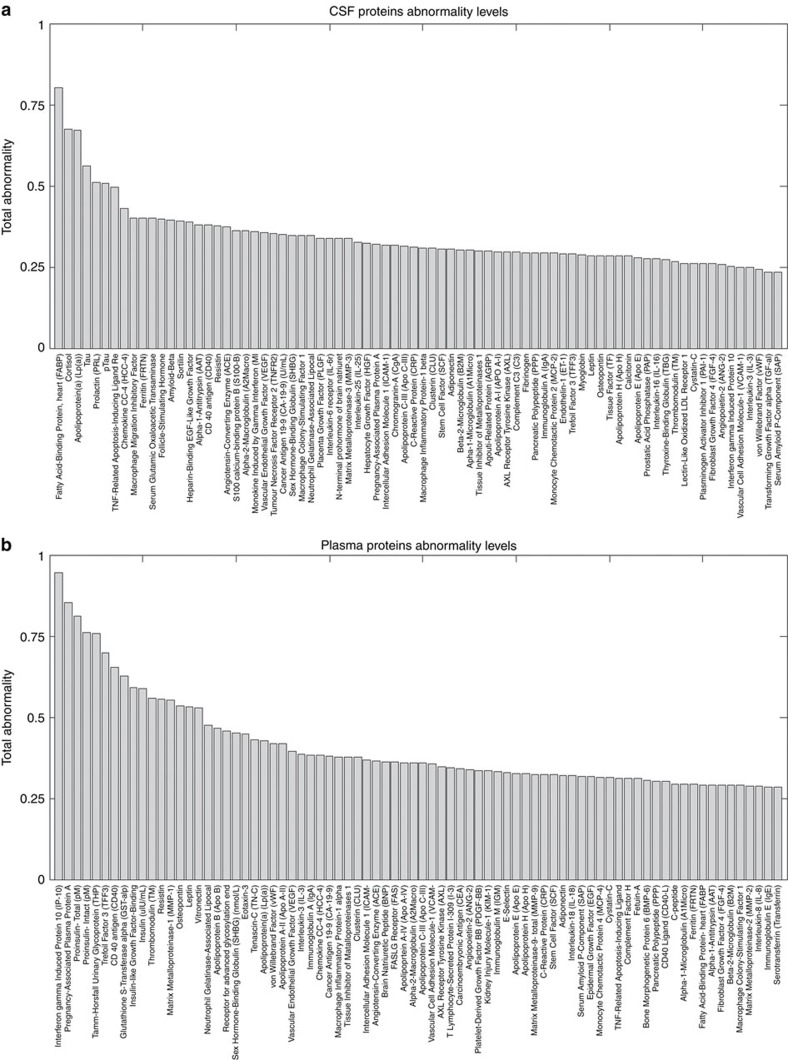
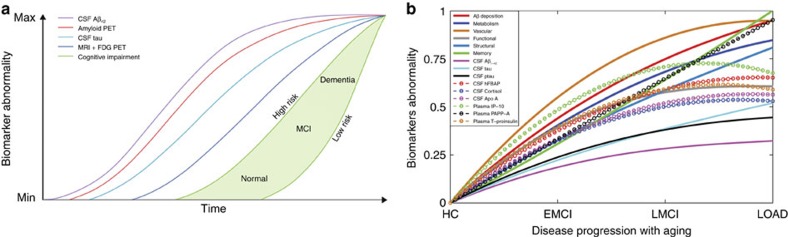
Multifactorial mechanisms underlying late-onset Alzheimer's disease (LOAD) are poorly characterized from an integrative perspective. Here spatiotemporal alterations in brain amyloid-β deposition, metabolism, vascular, functional activity at rest, structural properties, cognitive integrity and peripheral proteins levels are characterized in relation to LOAD progression. We analyse over 7,700 brain images and tens of plasma and cerebrospinal fluid biomarkers from the Alzheimer's Disease Neuroimaging Initiative (ADNI). Through a multifactorial data-driven analysis, we obtain dynamic LOAD-abnormality indices for all biomarkers, and a tentative temporal ordering of disease progression. Imaging results suggest that intra-brain vascular dysregulation is an early pathological event during disease development. Cognitive decline is noticeable from initial LOAD stages, suggesting early memory deficit associated with the primary disease factors. High abnormality levels are also observed for specific proteins associated with the vascular system's integrity. Although still subjected to the sensitivity of the algorithms and biomarkers employed, our results might contribute to the development of preventive therapeutic interventions.


Figures

Figure 1
Figure 1. Representation of the multifactorial data-driven generative approach.
(a) Brain multimodality images and plasma/CSF biomarkers. (b) Regional patterns for Aβ deposition across the entire sample. (c) Reconstructed regional Aβ characteristic trajectories for HC to LOAD (left) and HC to HC (right) clinical transitions, over a 30-year aging period. (d) Regional (left) and total (right) Aβ abnormality trajectories during the age-mediated clinical transitions.
Figure 2
Figure 2. Spatiotemporal abnormalities for LOAD progression (HC to AD clinical transitions) over a 30-year aging period.
Regional abnormality trajectories and LOAD–abnormality indices for Aβ deposition (a), metabolic dysfunction (b), vascular dysregulation (c), functional impairment (d) and grey matter atrophy (e).
Figure 3
Figure 3. Data-driven spatiotemporal ordering in LOAD progression.
(a) Hierarchical matrix reflecting pairwise comparisons in factor abnormality levels. Element i,j represents the total percentage of regions and time points at which the biological factor j is more abnormal than is the factor i. (b) Multifactorial temporal ordering in disease progression, based on the factor-specific abnormality trajectories (temporal abnormalities averaged across all brain regions), memory deficit and three CSF biomarkers (Aβ1−42, tau and ptau). All of the results were calculated for the HC to LOAD clinical transition. Dotted lines indicate 95 % confidence intervals, reflecting the uncertainties associated to the estimated mean trajectories, and obtained with 500 bootstrapping resamples. Inset figure provides detail of the trajectories obtained for early states of the disease (HC to EMCI transition). Note how in the initial states the vascular component is separating from the other components, while Aβ, metabolism and functional dysregulation remain close, with a notable overlap among their confidence intervals, until more advanced pathological states. See Supplementary Fig. 2 for equivalent results obtained evaluating the model assuming a sigmoid (instead of linear) relationship between age and disease state, respectively.
Figure 4
Figure 4. Regional total abnormality levels associated with LOAD progression.
Brain regions were sorted from maximum to minimum total effect values, to illustrate their multifactorial damage. Note the across-brain consistent change in the vascular component, which is considerably less prominent for other factors (for example, functional and structural alterations).
Figure 5
Figure 5. Total CSF and plasma biomarkers abnormality levels associated with LOAD progression.
Total CSF (a) and plasma (b) biomarkers abnormality levels associated with LOAD progression. For detailed lists of biospecimens and the obtained abnormality values for intermediate disease states, see Supplementary Tables 2 and 3.
Figure 6
Figure 6. Hypothetical and data-driven models of LOAD progression.
Hypothetical (a) and data-driven (b) models of LOAD progression. (a) Adapted from Jack et al., (with permission from Elsevier). (b) On the basis of our statistical analysis (Results section, Figs 2, 3, 4, 5, Supplementary Tables 2 and 3). Confidence intervals were omitted for visual clarity. Crucial inter-model differences are: (1) the absence of a vascular component in a and the subsequent assumption that Aβ measurements are the earliest biomarkers, whereas in b the vascular dysfunction is the earliest/stronger altered event, followed by Aβ deposition; (2) CSF Aβ42 and tau are proposed in a as the two major proteinopathies underlying LOAD, with higher sensitivity to disease progression than the metabolic/structural and memory biomarkers, however our results suggest that these proteins were not the strongest altered CSF proteins during disease progression (for example, plasma IP-10, PAPP-A and total proinsulin, and CSF hFABP, cortisol and Apo A, showed higher sensitivity) while imaging and memory biomarkers appeared consistently as earlier biomarkers (see Results section, and Supplementary Tables 2 and 3); (3) in a, abnormalities in cognitive decline are only detectable at advanced abnormality levels for the considered biological biomarkers. In contrast, in b, alterations in cognition are observable in parallel with changes in the primary disease factors (for example, vascular/metabolic dysfunction and Aβ deposition) and exceed in magnitude alterations observed for CSF Aβ1−42, tau and ptau.

References

    1. Buckner R. et al.. Molecular, structural, and functional characterization of Alzheimer's disease: evidence for a relationship between default activity, amyloid, and memory. J. Neurosci. 25, 7709–7717 (2005). - PMC - PubMed
    1. Frost B., Jacks R. & Diamond M. Propagation of tau misfolding from the outside to the inside of a cell. J. Biol. Chem. 284, 12845–12852 (2009). - PMC - PubMed
    1. Iadecola C. Review The Pathobiology of Vascular Dementia. Neuron 80, 844–866 (2013). - PMC - PubMed
    1. Iadecola C. Neurovascular regulation in the normal brain and in Alzheimer's disease. Nat. Rev. Neurosci. 5, 347–360 (2004). - PubMed
    1. Zlokovic B. V. Neurovascular pathways to neurodegeneration in Alzheimer's disease and other disorders. Nat. Rev. Neurosci. 12, 723–738 (2011). - PMC - PubMed

Publication types

MeSH terms