. 2016 Nov;15(21):2882-2894.
doi: 10.1080/15384101.2016.1198861. Epub 2016 Jun 21.

Lymphocyte lineage-specific and developmental stage specific mechanisms suppress cyclin D3 expression in response to DNA double strand breaks

Affiliations

Lymphocyte lineage-specific and developmental stage specific mechanisms suppress cyclin D3 expression in response to DNA double strand breaks

Amy DeMicco et al. Cell Cycle. 2016 Nov.

Abstract

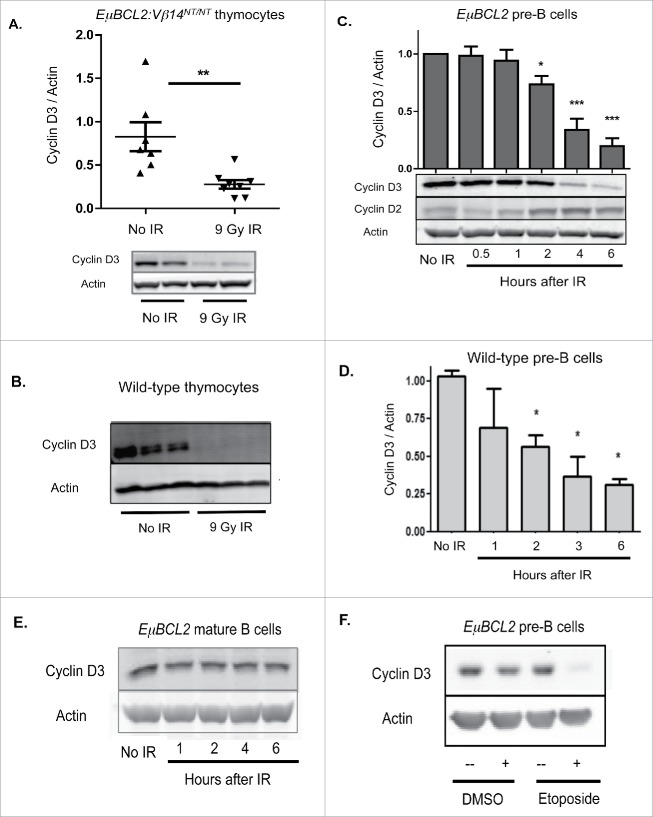
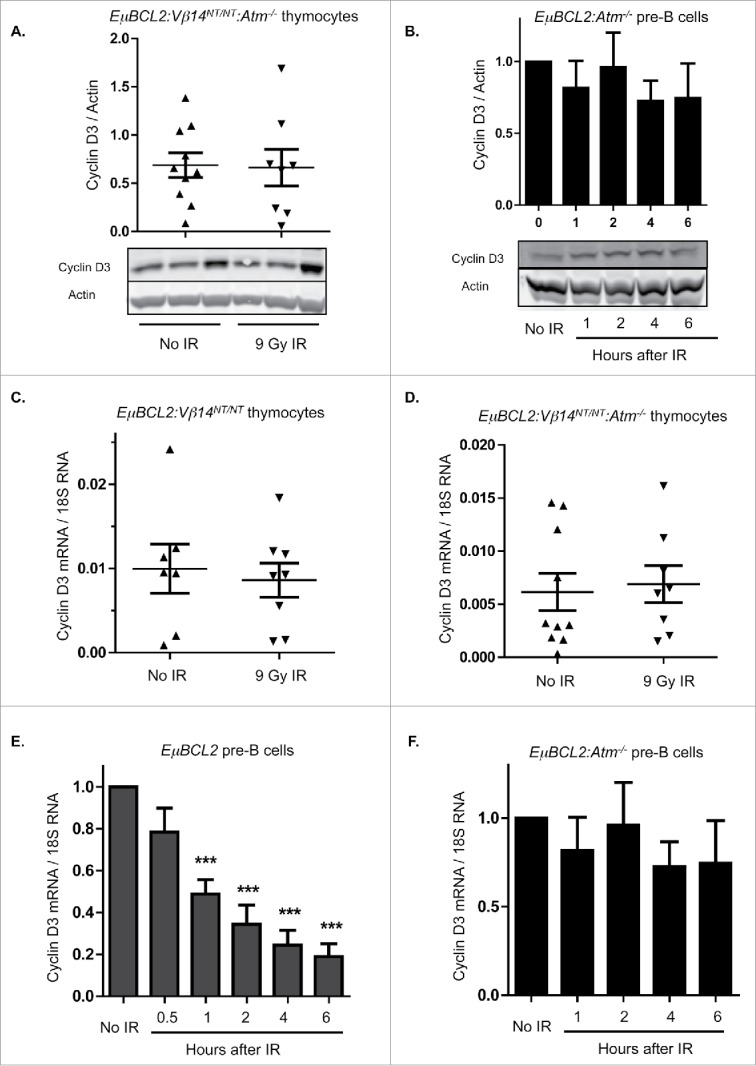
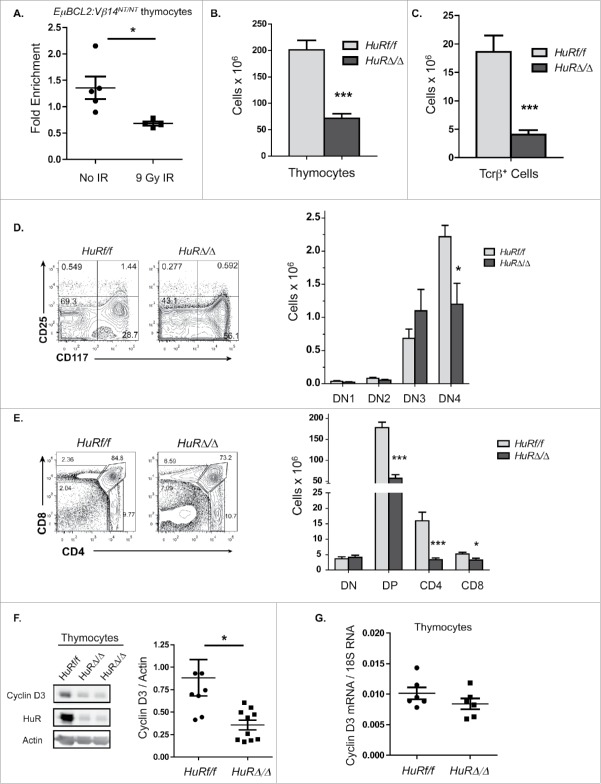
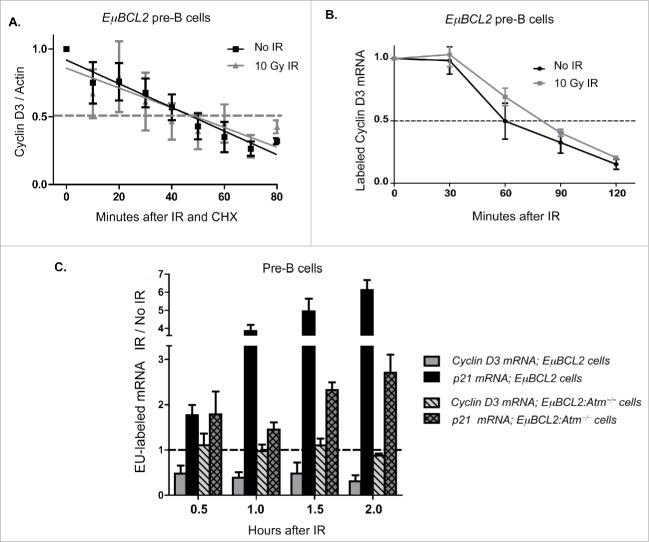
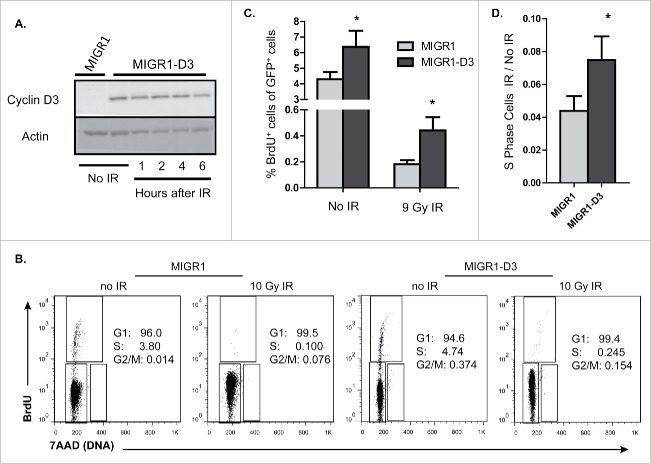
Mammalian cells are thought to protect themselves and their host organisms from DNA double strand breaks (DSBs) through universal mechanisms that restrain cellular proliferation until DNA is repaired. The Cyclin D3 protein drives G1-to-S cell cycle progression and is required for proliferation of immature T and B cells and of mature B cells during a T cell-dependent immune response. We demonstrate that mouse thymocytes and pre-B cells, but not mature B cells, repress Cyclin D3 protein levels in response to DSBs. This response requires the ATM protein kinase that is activated by DSBs. Cyclin D3 protein loss in thymocytes coincides with decreased association of Cyclin D3 mRNA with the HuR RNA binding protein that ATM regulates. HuR inactivation reduces basal Cyclin D3 protein levels without affecting Cyclin D3 mRNA levels, indicating that thymocytes repress Cyclin D3 expression via ATM-dependent inhibition of Cyclin D3 mRNA translation. In contrast, ATM-dependent transcriptional repression of the Cyclin D3 gene represses Cyclin D3 protein levels in pre-B cells. Retrovirus-driven Cyclin D3 expression is resistant to transcriptional repression by DSBs; this prevents pre-B cells from suppressing Cyclin D3 protein levels and from inhibiting DNA synthesis to the normal extent following DSBs. Our data indicate that immature B and T cells use lymphocyte lineage- and developmental stage-specific mechanisms to inhibit Cyclin D3 protein levels and thereby help prevent cellular proliferation in response to DSBs. We discuss the relevance of these cellular context-dependent DSB response mechanisms in restraining proliferation, maintaining genomic integrity, and suppressing malignant transformation of lymphocytes.

Keywords: ATM; Cyclin D3; DNA damage response; HuR; lymphocytes.


Figures

Figure 1.
Figure 1.
Lymphocyte developmental stage-specific downregulation of Cyclin D3 expression in response to DSBs. (A) Representative Western blot analyses of Cyclin D3 and actin protein and graphical quantification of Cyclin D3 protein expression in thymocytes of unirradiated or irradiated EμBCL2:Vβ14NT/NT mice at 4 hours after exposure of mice to 9 Gy of IR. Each data point is from a single mouse. This experiment was conducted 3 times with more than one unirradiated mouse and irradiated mouse each time. Error bars are standard error. **p < 0.01. (B) Representative Western blot analyses of Cyclin D3 and actin protein in thymocytes of unirradiated or irradiated wild-type mice at 4 hours after exposure of mice to 9 Gy of IR. (C) Representative Western blot analyses of Cyclin D3, Cyclin D2, and actin protein and graphical quantification of Cyclin D3 protein expression in unirradiated or irradiated IL7-cultured EμBCL2 pre-B cells at indicated times after exposure to 10 Gy of IR. Cyclin D3 expression levels are set to 1.0 for the unirradiated control in each experiment and other timepoints are normalized to control. (D) Graphical quantification of Cyclin D3 protein expression in unirradiated or irradiated IL7-cultured wild-type pre-B cells at indicated times after exposure to 10 Gy of IR. Cyclin D3 expression levels are set to 1.0 for the unirradiated control in each experiment and other timepoints are normalized to the control. (E) Representative Western blot analyses of Cyclin D3, Cyclin D2, and actin protein in unirradiated or irradiated LPS/IL4-stimulated EμBCL2 mature B cells at indicated times following their exposure to 9 Gy of IR. This experiment was conducted 3 times. (F) Representative Western blot analyses of Cyclin D3 and actin protein in IL7-cultured EμBCL2 pre-B cells untreated or 4 hours following addition of etoposide to media at a final concentration of 10 μg/mL. This experiment was conducted 3 times.
Figure 2.
Figure 2.
DSBs suppress Cyclin D3 expression via ATM-dependent lymphocyte lineage-specific mechanisms. (A) Representative Western blot analyses of Cyclin D3 and actin protein and graphical quantification of Cyclin D3 protein expression in thymocytes of unirradiated or irradiated EμBCL2:Vβ14NT/NT:Atm−/− mice at 4 hours following exposure of mice to 9 Gy of IR. Each lane contains thymocyte protein from a single mouse. This experiment was conducted 4 times with a total of 10 unirradiated and 8 irradiated mice. Error bars are standard error. (B) Representative Western blot analyses of Cyclin D3 and actin protein and graphical quantification of Cyclin D3 protein expression in unirradiated or irradiated IL7-cultured EμBCL2:Atm−/− pre-B cells at indicated times after exposure to 9 Gy of IR. This experiment was conducted 4 times with more than one unirradiated mouse and more than one irradiated mouse each time. Error bars are standard error. ((C)- D) Graphical quantification of Cyclin D3 mRNA levels relative to 18S RNA levels in thymocytes from unirradiated or irradiated EμBCL2:Vβ14NT/NT mice (C) or EμBCL2:Vβ14NT/NT:Atm−/− (D) mice at 4 hours after exposure to 9 Gy IR. Each data point is from a single mouse. Each of these experiments was conducted 4 times with a total of 10 unirradiated and 8 irradiated mice. Error bars are standard error. (E- F) Graphical quantification of Cyclin D3 mRNA levels relative to 18S RNA levels in unirradiated or irradiated IL7-cultured EμBCL2 (E) or EμBCL2:Atm−/− (F) pre-B cells at indicated times after exposure to 10 Gy of IR. Cyclin D3 expression levels are set to 1.0 for the unirradiated control in each experiment and other time points are normalized to this control. These experiments were performed 4 times. Error bars are standard error. ***p < 0.001 in comparison to the unirradiated control.
Figure 3.
Figure 3.
DSBs induced in thymocytes inhibit Cyclin D3 protein levels and cellular proliferation by disrupting association of HuR with Cyclin D3 mRNAs. (A) Graph quantifying association of HuR with Cyclin D3 mRNAs in thymocytes of unirradiated or irradiated EμBCL2:Vβ14NT/NT mice at 4 hours after exposure to 10 Gy of IR. Fold enrichment is the amount of Cyclin D3 mRNA relative to the amount of Gapdh mRNA precipitated by the anti-HuR antibody normalized to the amount of Cyclin D3 mRNA relative to the amount of Gapdh mRNA precipitated by normal IgG antibody. Each data point is from a single mouse. This experiment was conducted 3 times. Error bars are standard error. *p < 0.05. (B-C) Graphs depicting the average numbers of thymocytes (B) and splenic αβ T cells (C) in HuRf/f and HuRΔ/Δ mice. This experiment was conducted 5 times. Error bars are standard error. ***p < 0.001. (D) Representative flow cytometry analysis and graphical quantification of thymocytes at the DN3 and DN4 stages in HuRf/f and HuRΔ/Δ mice. This experiment was conducted 5 times. Error bars are standard error. *p < 0.05. (E) Representative flow cytometry analysis and graphical quantification of thymocytes at the DN, DP, and CD4+ or CD8+ SP stages in HuRf/f or HuRΔ/Δ mice. This experiment was conducted 5 times. Error bars are standard error. *p < 0.05 and ***p < 0.001. (F) Representative Western blot analyses of HuR, Cyclin D3, and actin protein and graphical quantification of Cyclin D3 protein expression in thymocytes of HuRf/f or HuRΔ/Δ mice. This experiment was conducted 4 times on a total of 8 HuRf/f and 10 HuRΔ/Δ mice. Error bars are standard error. *p < 0.05. (G) Graphical quantification of Cyclin D3 mRNA levels relative to 18S RNA levels in thymocytes from HuRf/f and HuRΔ/Δ mice. Each data point is from a single mouse. This experiment was conducted twice with 3 mice of each genotype each time.
Figure 4.
Figure 4.
DSBs induced in pre-B Cells suppress Cyclin D3 protein levels through ATM-dependent inhibition of Ccnd3 transcription. (A) Western blot quantification of Cyclin D3 protein levels relative to actin protein levels in unirradiated or irradiated IL7-cultured EμBCL2 pre-B cells at indicated times after addition of cycloheximide and/or exposure to 10 Gy of IR. This experiment was performed 6 times. Values are normalized to 1.0 for unirradiated cells immediately after cycloheximide addition within each experiment. (B) qRT-PCR quantification of EU-labeled Cyclin D3 mRNA levels relative to EU-labeled 18S RNA levels in unirradiated or irradiated IL7-cultured EμBCL2 pre-B cells at indicated times after EU washout and/or exposure to 10 Gy of IR. Values are normalized to 1.0 for cells immediately before IR within each experiment. This experiment was performed 4 times. (C) qRT-PCR quantification of EU-labeled Cyclin D3 and p21 mRNA levels relative to total/EU-labeled Hprt levels in unirradiated and irradiated IL7-cultured EμBCL2 and EμBCL2:Atm−/− pre-B cells at indicated times after addition of EU and exposure to 10 Gy of IR. Data are presented as the ratio of relative levels of each mRNA in irradiated cells compared to unirradiated cells. The dotted line represents a value of 1, which would indicate that IR had no effect on the transcription rate of an assayed gene(s). This experiment was performed 3 times. Error bars are standard error. Statistical analysis using the 2-way ANOVA method indicates all differences are significant (p < 0.001).
Figure 5.
Figure 5.
Retroviral expression of Cyclin D3 in pre-B cells prevents repression of Cyclin D3 Protein and impairs G1 arrest in response to DSBs. (A) Representative Western blot analyses of Cyclin D3 and actin protein in unirradiated or irradiated IL7-cultured EμBCL2:Ccnd3−/− pre-B cells transduced with MIGR1 or MIGR1-D3 at indicated times following exposure to 10 Gy of IR. (B) Representative flow cytometry analysis of the cell cycle of unirradiated or irradiated IL7-cultured EμBCL2 pre-B cells transduced with MIGR1 or MIGR1-D3 at 6 hours after exposure to 10 Gy of IR. (C) Graph depicting quantification of the fraction of unirradiated or irradiated IL7-cultured EμBCL2 pre-B cells transduced with MIGR1 or MIGR1-D3 that are BrdU+ at 6 hours following IR. This experiment was conducted 3 times. Error bars are standard error. *p < 0.05. (D) Graph depicting the ratios of the fraction of each cell type in B and C that synthesizes DNA after IR vs. before IR. Error bars are standard error. *p < 0.05.

Comment in

  • Cyclin D3: To translate or not to translate.
    Diehl JA. Diehl JA. Cell Cycle. 2016 Nov 16;15(22):3018-3019. doi: 10.1080/15384101.2016.1215704. Epub 2016 Aug 11. Cell Cycle. 2016. PMID: 27715408 Free PMC article. No abstract available.

References

    1. Sherr CJ, Roberts JM. Living with or without cyclins and cyclin-dependent kinases. Genes Dev 2004; 18(22):2699-711; PMID:15545627; http://dx.doi.org/10.1101/gad.1256504 - DOI - PubMed
    1. Malumbres M, Barbacid M. Cell cycle, CDKs and cancer: a changing paradigm. Nat Rev Cancer 2009; 9(3):153-66; PMID:19238148; http://dx.doi.org/10.1038/nrc2602 - DOI - PubMed
    1. Musgrove EA, Caldon CE, Barraclough J, Stone A, Sutherland RL. Cyclin D as a therapeutic target in cancer. Nat Rev Cancer 2011; 11(8):558-72; PMID:21734724; http://dx.doi.org/10.1038/nrc3090 - DOI - PubMed
    1. Deckbar D, Jeggo PA, Lobrich M. Understanding the limitations of radiation-induced cell cycle checkpoints. Crit Rev Biochem Mol Biol 2011; 46(4):271-83; PMID:21524151; http://dx.doi.org/10.3109/10409238.2011.575764 - DOI - PMC - PubMed
    1. Diehl JA. The cyclin D3 knockout: a pound of redundancy with a dash of tissue specificity. Cancer Biol Ther 2004; 3(2):162-4; PMID:14752277; http://dx.doi.org/10.4161/cbt.3.2.774 - DOI - PubMed

MeSH terms