

Sodium-Glucose Cotransporter 2 Inhibitor and a Low Carbohydrate Diet Affect Gluconeogenesis and Glycogen Content Differently in the Kidney and the Liver of Non-Diabetic Mice
- PMID: 27327650
- PMCID: PMC4915669
- DOI: 10.1371/journal.pone.0157672
Sodium-Glucose Cotransporter 2 Inhibitor and a Low Carbohydrate Diet Affect Gluconeogenesis and Glycogen Content Differently in the Kidney and the Liver of Non-Diabetic Mice
Abstract
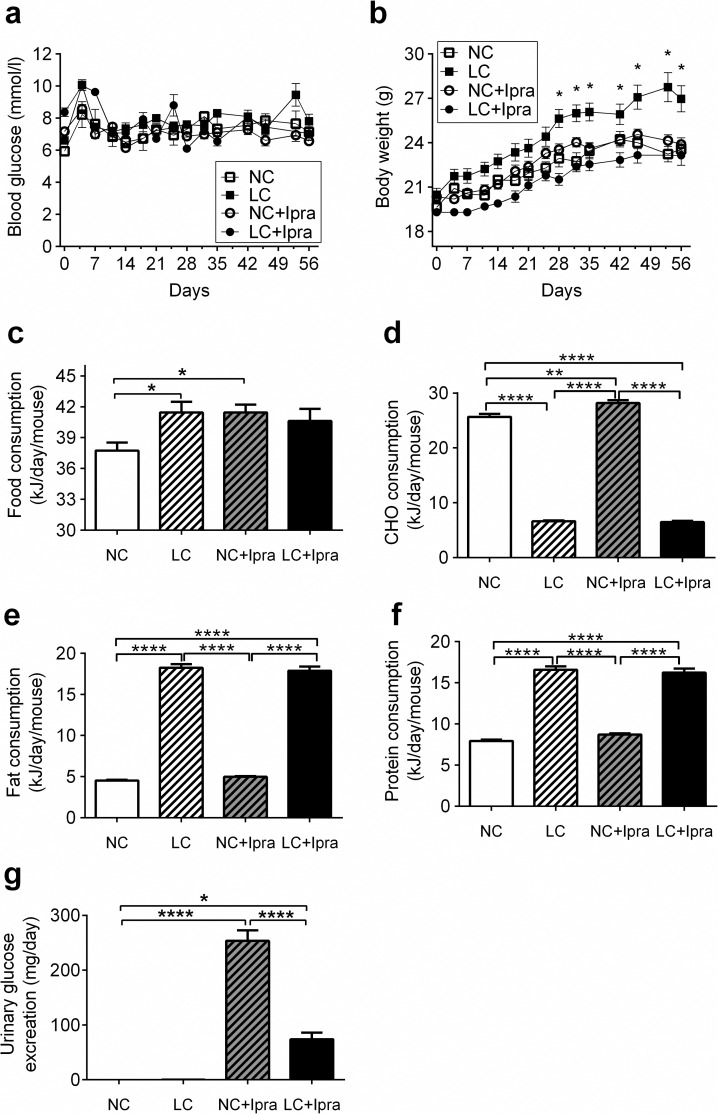
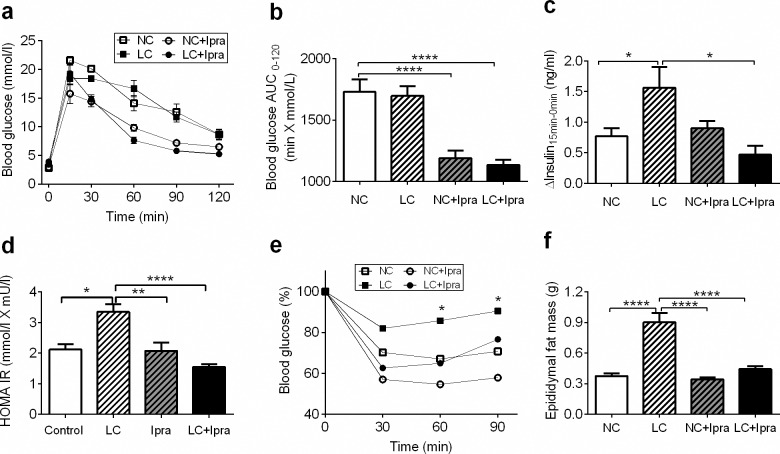
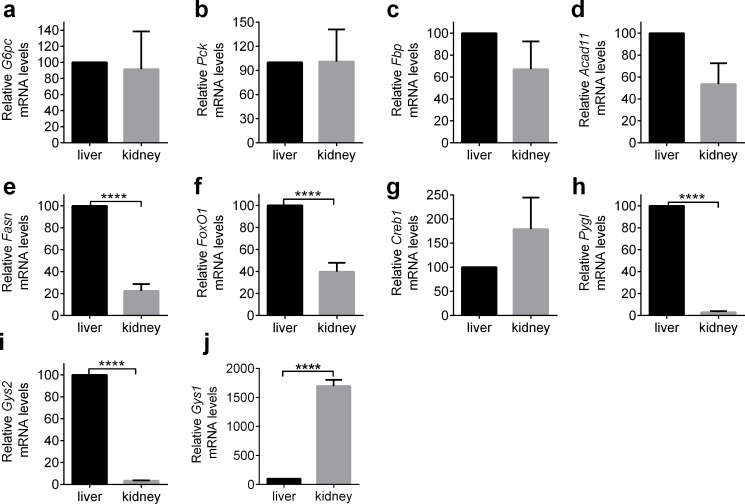
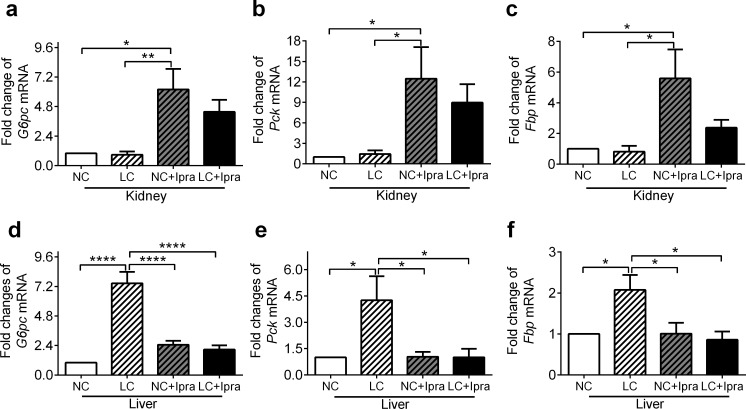
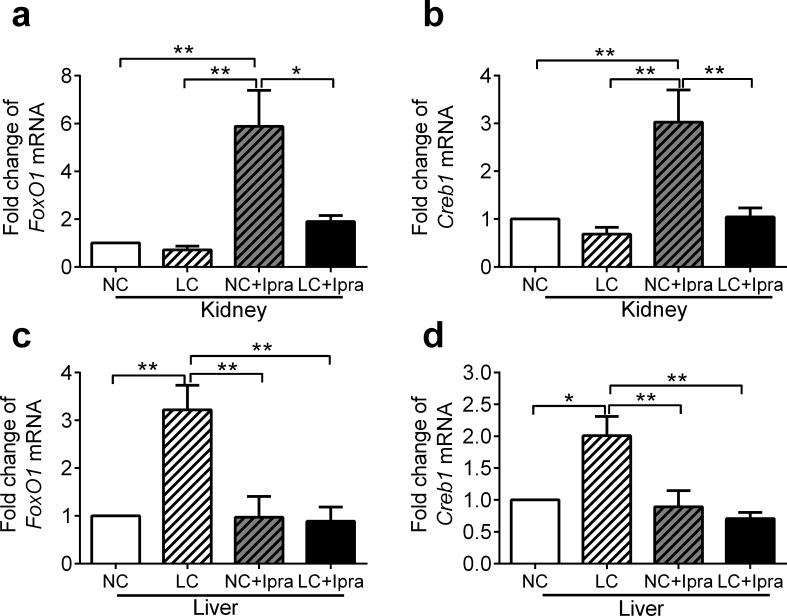
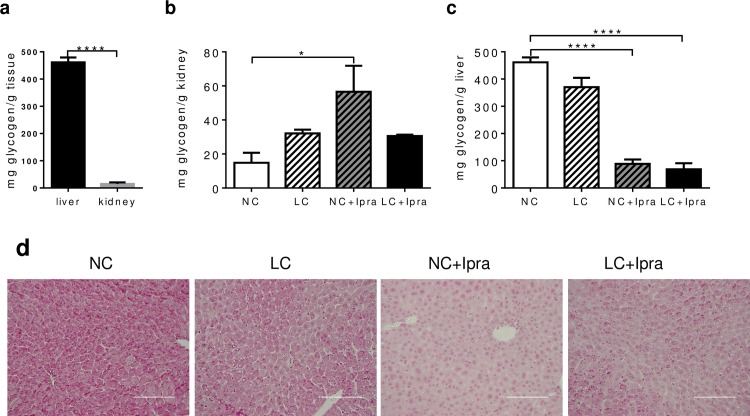
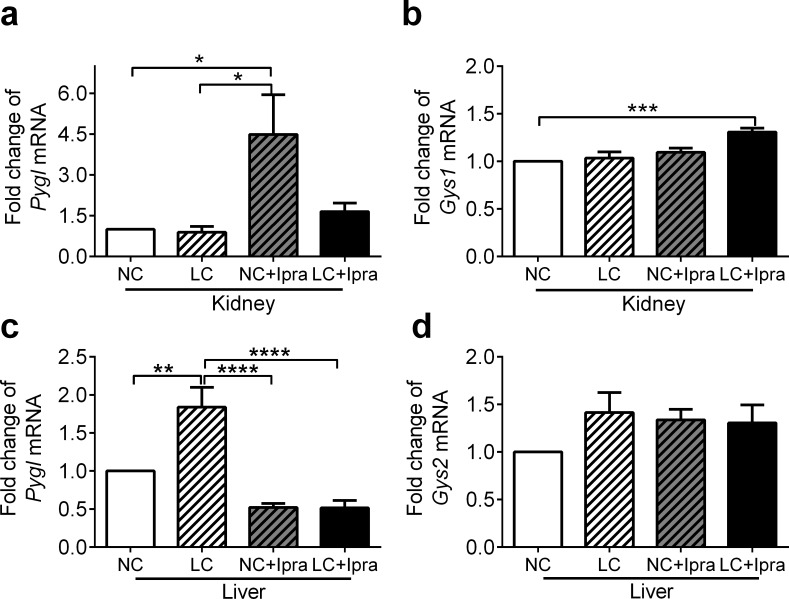
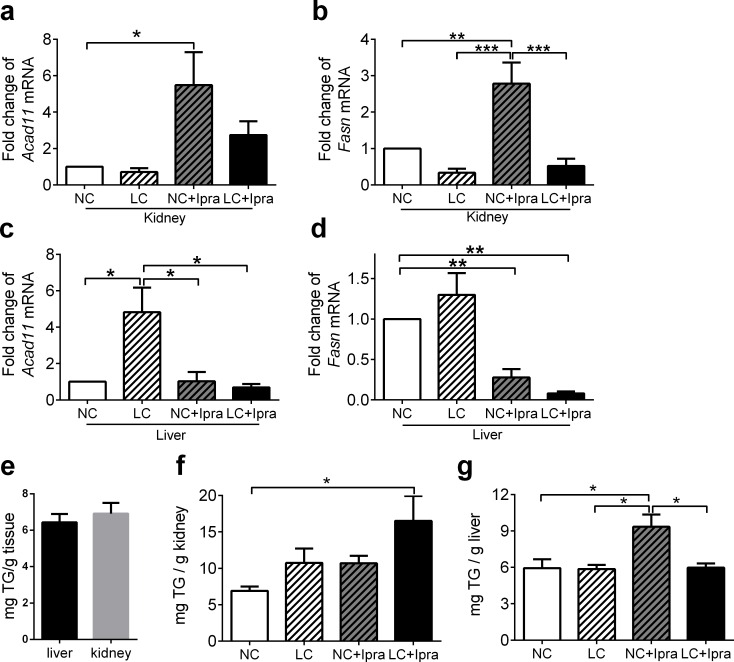
A low carbohydrate diet (LCHD) as well as sodium glucose cotransporter 2 inhibitors (SGLT2i) may reduce glucose utilization and improve metabolic disorders. However, it is not clear how different or similar the effects of LCHD and SGLT2i are on metabolic parameters such as insulin sensitivity, fat accumulation, and especially gluconeogenesis in the kidney and the liver. We conducted an 8-week study using non-diabetic mice, which were fed ad-libitum with LCHD or a normal carbohydrate diet (NCHD) and treated with/without the SGLT-2 inhibitor, ipragliflozin. We compared metabolic parameters, gene expression for transcripts related to glucose and fat metabolism, and glycogen content in the kidney and the liver among the groups. SGLT2i but not LCHD improved glucose excursion after an oral glucose load compared to NCHD, although all groups presented comparable non-fasted glycemia. Both the LCHD and SGLT2i treatments increased calorie-intake, whereas only the LCHD increased body weight compared to the NCHD, epididimal fat mass and developed insulin resistance. Gene expression of certain gluconeogenic enzymes was simultaneously upregulated in the kidney of SGLT2i treated group, as well as in the liver of the LCHD treated group. The SGLT2i treated groups showed markedly lower glycogen content in the liver, but induced glycogen accumulation in the kidney. We conclude that LCHD induces deleterious metabolic changes in the non-diabetic mice. Our results suggest that SGLT2i induced gluconeogenesis mainly in the kidney, whereas for LCHD it was predominantly in the liver.
Conflict of interest statement
Figures
Similar articles
-
A Low-Carbohydrate Diet Improves Glucose Metabolism in Lean Insulinopenic Akita Mice Along With Sodium-Glucose Cotransporter 2 Inhibitor.Front Endocrinol (Lausanne). 2020 Dec 11;11:601594. doi: 10.3389/fendo.2020.601594. eCollection 2020. Front Endocrinol (Lausanne). 2020. PMID: 33362717 Free PMC article.
-
Ipragliflozin Improves Hepatic Steatosis in Obese Mice and Liver Dysfunction in Type 2 Diabetic Patients Irrespective of Body Weight Reduction.PLoS One. 2016 Mar 15;11(3):e0151511. doi: 10.1371/journal.pone.0151511. eCollection 2016. PLoS One. 2016. PMID: 26977813 Free PMC article.
-
Effects of sodium-glucose cotransporter 2 selective inhibitor ipragliflozin on hyperglycaemia, oxidative stress, inflammation and liver injury in streptozotocin-induced type 1 diabetic rats.J Pharm Pharmacol. 2014 Jul;66(7):975-87. doi: 10.1111/jphp.12223. Epub 2014 Feb 17. J Pharm Pharmacol. 2014. PMID: 24533859
-
Molecular signaling mechanisms of renal gluconeogenesis in nondiabetic and diabetic conditions.J Cell Physiol. 2019 Jun;234(6):8134-8151. doi: 10.1002/jcp.27598. Epub 2018 Oct 28. J Cell Physiol. 2019. PMID: 30370538 Review.
-
The effects of trauma on carbohydrate metabolism.Br J Anaesth. 1973 Mar;45(3):244-51. doi: 10.1093/bja/45.3.244. Br J Anaesth. 1973. PMID: 4572999 Review. No abstract available.
Cited by
-
Liver or kidney: Who has the oar in the gluconeogenesis boat and when?World J Diabetes. 2023 Jul 15;14(7):1049-1056. doi: 10.4239/wjd.v14.i7.1049. World J Diabetes. 2023. PMID: 37547592 Free PMC article. Review.
-
Time-dependent effects of ipragliflozin on behaviour and energy homeostasis in normal and type 2 diabetic rats: continuous glucose telemetry analysis.Sci Rep. 2017 Sep 19;7(1):11906. doi: 10.1038/s41598-017-12106-y. Sci Rep. 2017. PMID: 28928461 Free PMC article.
-
Effect of Dapagliflozin on Renal and Hepatic Glucose Kinetics in T2D and NGT Subjects.Diabetes. 2024 Jun 1;73(6):896-902. doi: 10.2337/db23-0457. Diabetes. 2024. PMID: 38512770 Free PMC article. Clinical Trial.
-
A Low-Carbohydrate Diet Improves Glucose Metabolism in Lean Insulinopenic Akita Mice Along With Sodium-Glucose Cotransporter 2 Inhibitor.Front Endocrinol (Lausanne). 2020 Dec 11;11:601594. doi: 10.3389/fendo.2020.601594. eCollection 2020. Front Endocrinol (Lausanne). 2020. PMID: 33362717 Free PMC article.
-
Differential effects of sodium-glucose cotransporter 2 inhibitor and low-carbohydrate diet on body composition and metabolic profile in obese diabetic db/db mice.BMJ Open Diabetes Res Care. 2020 Sep;8(1):e001303. doi: 10.1136/bmjdrc-2020-001303. BMJ Open Diabetes Res Care. 2020. PMID: 32883687 Free PMC article.
References
-
- Heller RF, Heller RF. Hyperinsulinemic obesity and carbohydrate addiction: the missing link is the carbohydrate frequency factor. Med Hypotheses. 1994;42(5):307–12. . - PubMed
MeSH terms
Substances
LinkOut - more resources
Full Text Sources
Other Literature Sources
