. 2016 Sep;25(9):1744-52.
doi: 10.1002/pro.2968. Epub 2016 Jul 4.

Structural insights into SAM domain-mediated tankyrase oligomerization

Affiliations

Structural insights into SAM domain-mediated tankyrase oligomerization

Paul A DaRosa et al. Protein Sci. 2016 Sep.

Abstract

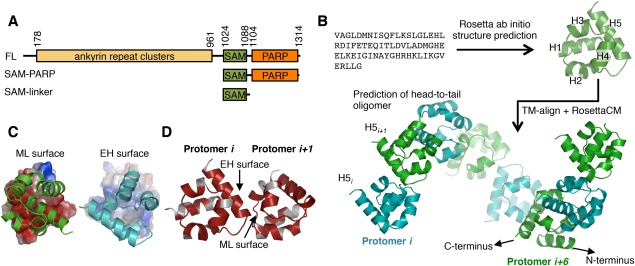
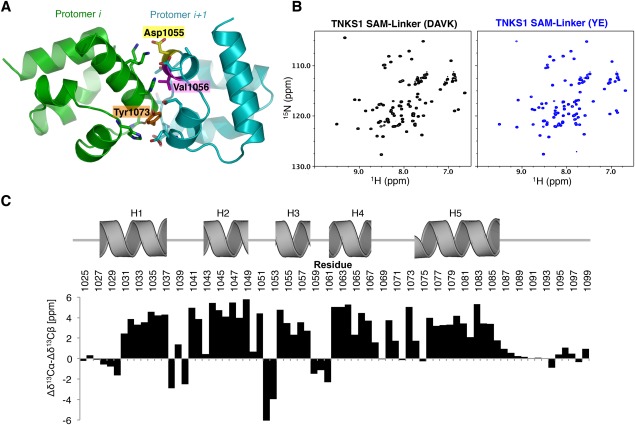
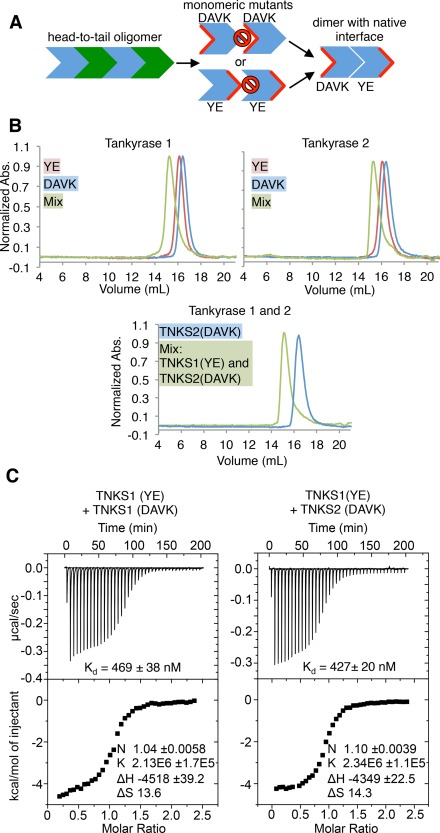
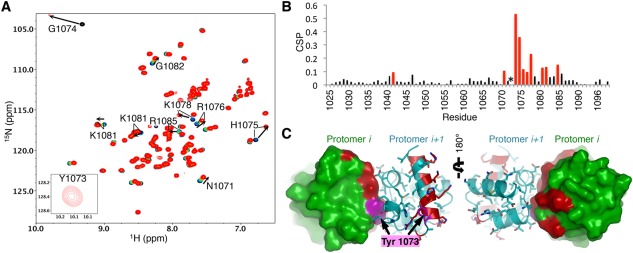
Tankyrase 1 (TNKS1; a.k.a. ARTD5) and tankyrase 2 (TNKS2; a.k.a ARTD6) are highly homologous poly(ADP-ribose) polymerases (PARPs) that function in a wide variety of cellular processes including Wnt signaling, Src signaling, Akt signaling, Glut4 vesicle translocation, telomere length regulation, and centriole and spindle pole maturation. Tankyrase proteins include a sterile alpha motif (SAM) domain that undergoes oligomerization in vitro and in vivo. However, the SAM domains of TNKS1 and TNKS2 have not been structurally characterized and the mode of oligomerization is not yet defined. Here we model the SAM domain-mediated oligomerization of tankyrase. The structural model, supported by mutagenesis and NMR analysis, demonstrates a helical, homotypic head-to-tail polymer that facilitates TNKS self-association. Furthermore, we show that TNKS1 and TNKS2 can form (TNKS1 SAM-TNKS2 SAM) hetero-oligomeric structures mediated by their SAM domains. Though wild-type tankyrase proteins have very low solubility, model-based mutations of the SAM oligomerization interface residues allowed us to obtain soluble TNKS proteins. These structural insights will be invaluable for the functional and biophysical characterization of TNKS1/2, including the role of TNKS oligomerization in protein poly(ADP-ribosyl)ation (PARylation) and PARylation-dependent ubiquitylation.

Keywords: PARP; PARP5; PARylation; SAM; molecular model; oligomerization; protein poly(ADP-ribosyl)ation; sterile alpha motif; tankyrase.


Figures

Figure 1
Figure 1
Modeling tankyrase SAM domain oligomerization. (A) The TNKS1 domain architecture and constructs used in this manuscript. TNKS2 is homologous to TNKS1, but lacks a ∼170 amino acid N‐terminal histidine serine proline rich region in Tankyrase 1. FL; full‐length. (B) Schematic of the TNKS1 SAM domain structure and oligomeric structure prediction workflow. First, the amino acid sequence was used for structure prediction using Rosetta, followed by a TM‐align search for similar folds participating in SAM‐SAM interactions used as initial docking positions for a RosettaCM TNKS1 oligomer modeling protocol with helical symmetry. H1‐5; Helix 1, 2, 3, 4, and 5. Protomers are colored either green or cyan to clarify oligomeric structure. (C) Surface charges experienced by opposing faces of the oligomer protomers. Between the two interacting surfaces, the mid‐loop (ML) surface (left) is negatively charged (red), whereas the end‐helix (EH) surface is enriched in positively (blue) charged residues (right). (D) Conservation of residues between TNKS1 and TNKS2 plotted on the surface of the TNKS1 model showing sequence identity (red) at the interface of the two protomers. White; non‐identical. See also Supporting Information Figure S1.
Figure 2
Figure 2
SAM mutants retain a folded structure. (A) Residues at the interface of two protomers in the predicted oligomer interface of TNKS1. Residues that were mutated to disrupt oligomerization are highlighted. (B) 1H15N‐HSQC NMR analysis of the TNKS1 SAM‐Linker(DAVK) mutant (left), and the TNKS1 SAM‐Linker(YE) mutant (right). DAVK, D1055A/V1056K; YE, Y1073E. Both spectra are well dispersed and highly similar, consistent with folded, monomeric domains. (C) Chemical shift differences between random coil and experimentally determined Cα and Cβ atoms (Δδ13Cα‐Δδ13Cβ [ppm]). Positions of Rosetta‐predicted helices are shown above histogram. High values are predictive of helical structure.
Figure 3
Figure 3
Tankyrase 1/2 SAM form strong homo and hetero‐oligomers. (A) Conceptual schematic of experiments in Figure 3. Residues are mutated on one face of the oligomeric interface to generate monomers (center). Complementary monomers can be mixed to generate dimers (right). Red indicates mutated surface. Prohibition signs indicate “no binding”. YE, TNKS1 Y1073E or TNKS2 Y920E; DAVK, TNKS1 D1055A/V1056K, or TNKS2 D902A/V903K. (B) Size exclusion chromatography (SEC) chromatograms of tankyrase 1 (top left) and tankyrase 2 (top right) SAM‐PARP YE and DAVK mutants. (Bottom) SEC trace of a 1:1 mixture of SAM‐PARP TNKS1 YE and TNKS2 DAVK, with TNKS2 DAVK elution profile shown as a reference. The maximum absorbance at 280 nm (y‐axis) is normalized to 1 for each trace. (C) Isothermal titration calorimetry (ITC) of TNKS1 SAM‐Linker YE with DAVK mutants (left; K d of 469 ± 38 nM), and TNKS1 SAM‐Linker(YE) with TNKS2 SAM‐Linker(DAVK) (right; K d of 427 ± 20 nM). K d, dissociation constants.
Figure 4
Figure 4
NMR mapping of the oligomeric interface supports model. (A) 1H15N‐HSQC of 150 µM TNKS1 SAM‐Linker(D1055A/V1056K) (black) with increasing quantities of TNKS1 SAM‐Linker(Y1073E): 0.25 molar equivalence (mol. eq.) (blue), 0.5 mol. eq. (green), 0.75 mol. eq. (orange), and 1.1 mol. eq. (red). A weak peak is seen for Y1073 at 1.1 mol. eq. when a spectrum was obtained at 250 µM TNKS1 SAM‐Linker (D1055A/V1056K), but not in the unbound spectrum in matching conditions (inset). (B) Chemical shift perturbations (CSPs) determined between the 0 mol. eq. (black) and 1.1 mol. eq. (red) spectra shown in (A) plotted against residue number. Red bars indicate the top 15% most perturbed residues. Asterisk (*) indicates Y1073, which only has a detectable peak in the dimeric form. (C) Residues shown in (B) are plotted (red) on the surface/cartoon representation of two neighboring protomers (cyan and green) of the oligomer. The residue highlight in magenta is Y1073. The binding surface recapitulates the predicted interface between protomers.

References

    1. Huang S‐MA, Mishina YM, Liu S, Cheung A, Stegmeier F, Michaud GA, Charlat O, Wiellette E, Zhang Y, Wiessner S, Hild M, Shi X, Wilson CJ, Mickanin C, Myer V, Fazal A, Tomlinson R, Serluca F, Shao W, Cheng H, Shultz M, Rau C, Schirle M, Schlegl J, Ghidelli S, Fawell S, Lu C, Curtis D, Kirschner MW, Lengauer C, Finan PM, Tallarico JA, Bouwmeester T, Porter JA, Bauer A, Cong F (2009) Tankyrase inhibition stabilizes axin and antagonizes Wnt signalling. Nature 461:614–620. - PubMed
    1. Levaot N, Voytyuk O, Dimitriou I, Sircoulomb F, Chandrakumar A, Deckert M, Krzyzanowski PM, Scotter A, Gu S, Janmohamed S, Cong F, Simoncic PD, Ueki Y, La Rose J, Rottapel R (2011) Loss of Tankyrase‐mediated destruction of 3BP2 is the underlying pathogenic mechanism of cherubism. Cell 147:1324–1339. - PMC - PubMed
    1. Wang W, Li N, Li X, Tran MK, Han X, Chen J (2015) Tankyrase inhibitors target YAP by stabilizing angiomotin family proteins. Cell Rep 13:524–532. - PMC - PubMed
    1. Smith S, De Lange T (2000) Tankyrase promotes telomere elongation in human cells. Curr Biol 10:1299–1302. - PubMed
    1. Yeh T‐YJ, Sbodio JI, Tsun ZY, Luo B, Chi NW (2007) Insulin‐stimulated exocytosis of GLUT4 is enhanced by IRAP and its partner tankyrase. Biochem J 402:279–290. - PMC - PubMed

Publication types