. 2016 Jun 22:7:12008.
doi: 10.1038/ncomms12008.

Whole-genome plasma sequencing reveals focal amplifications as a driving force in metastatic prostate cancer

Affiliations

Whole-genome plasma sequencing reveals focal amplifications as a driving force in metastatic prostate cancer

Peter Ulz et al. Nat Commun. .

Abstract

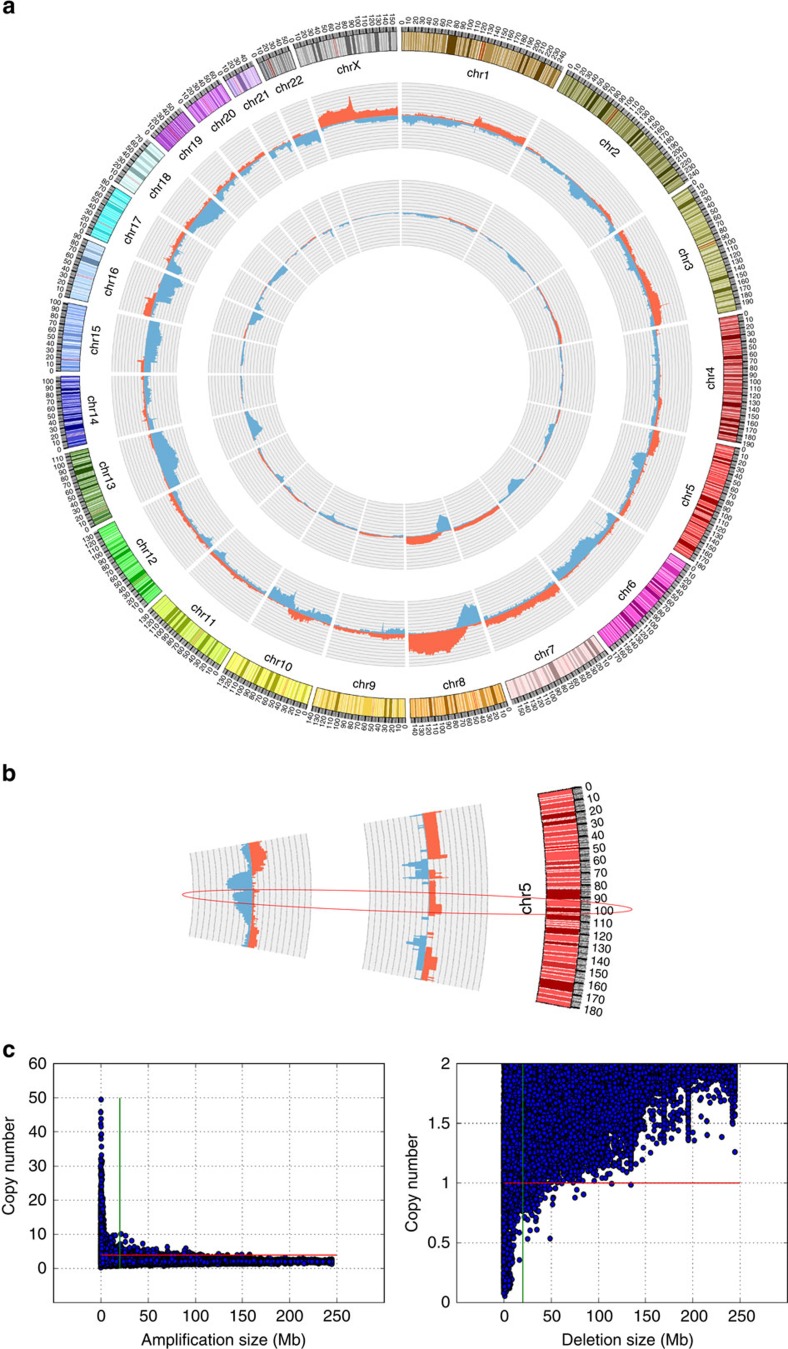
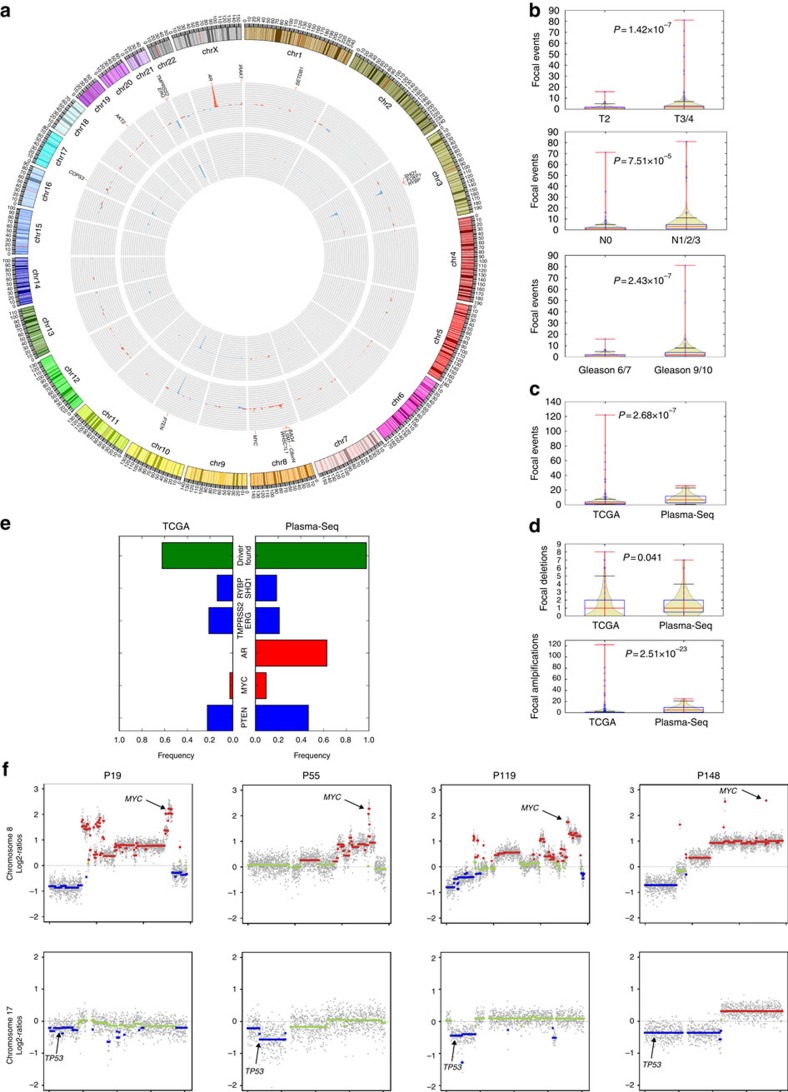
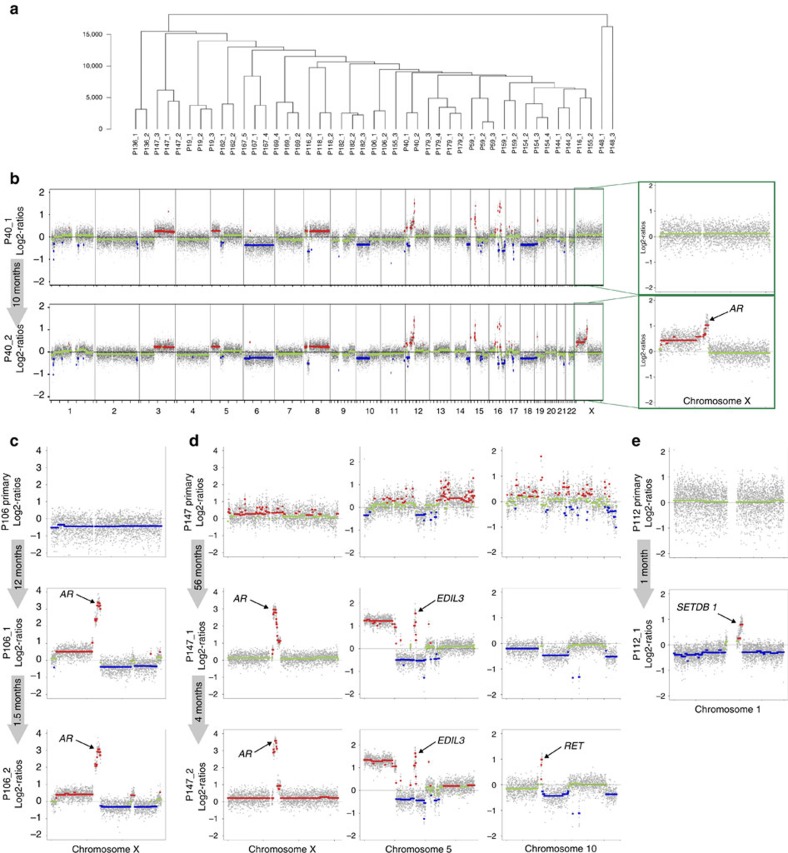
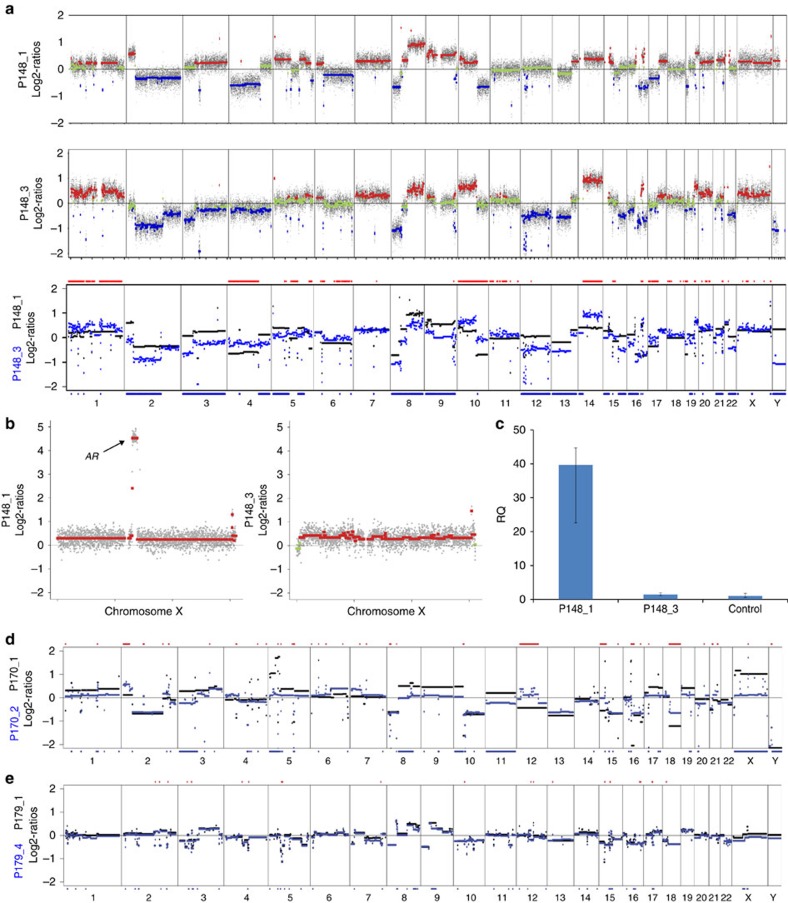
Genomic alterations in metastatic prostate cancer remain incompletely characterized. Here we analyse 493 prostate cancer cases from the TCGA database and perform whole-genome plasma sequencing on 95 plasma samples derived from 43 patients with metastatic prostate cancer. From these samples, we identify established driver aberrations in a cancer-related gene in nearly all cases (97.7%), including driver gene fusions (TMPRSS2:ERG), driver focal deletions (PTEN, RYBP and SHQ1) and driver amplifications (AR and MYC). In serial plasma analyses, we observe changes in focal amplifications in 40% of cases. The mean time interval between new amplifications was 26.4 weeks (range: 5-52 weeks), suggesting that they represent rapid adaptations to selection pressure. An increase in neuron-specific enolase is accompanied by clonal pattern changes in the tumour genome, most consistent with subclonal diversification of the tumour. Our findings suggest a high plasticity of prostate cancer genomes with newly occurring focal amplifications as a driving force in progression.


Figures

Figure 1
Figure 1. Overall characterization of SCNAs in TCGA and plasma samples.
(a) Circos plot illustrating the relative frequency of SCNAs (gains in red and losses in blue) of 493 prostate cancer cases from the TCGA database (inner circle) and 95 plasma samples from patients with metastasized prostate cancer (middle circle). The outer circle shows ideograms of the respective chromosomes. (b) Partial chromosome 5 circos plot of plasma samples without (inner segment) and with (middle segment) TMPRSS2:ERG fusion, the ellipse marks the CHD1 region. (c) Scatter plot of 30 genes commonly involved in amplifications (left panel; green bar: 20 Mb; red bar: copy number of 4) and 42 genes frequently involved in focal deletions (right panel; green bar: 20 Mb; red bar: copy number of 1) derived from 5,737 cases of the TCGA pan-cancer data set demonstrating an inverse relationship between amplification and deletion size, respectively, as well as copy numbers.
Figure 2
Figure 2. Focal SCNAs in TCGA and plasma prostate cancer samples.
(a) Circos plot of focal SCNAs in the TCGA database (inner circle) and the plasma samples (middle circle) depicting the relative frequency (Y axis limit for amplifications and deletions: 50%) of focal events (gains in red and losses in blue). The outer circle shows ideograms of the respective chromosomes. Target genes of focal SCNAs are annotated if they were observed in >5% of TCGA/plasma samples. (b) Boxplot and probability densities of focal SCNA calls for T-stage (top), and N-stage (centre), and Gleason score (bottom). Box comprises data from the first to the third quartile (interquartile range, IQR, in blue) and whiskers (black) extend to the 1.5 × IQR from the box. The median is displayed in red. Probability densities (based on Kernel density estimates) are displayed in ochre and data ranges are displayed in red. P values were calculated using Mann–Whitney U-tests. (c) Boxplot and probability densities of focal copy-number changes in the TCGA and plasma datasets (Whiskers, horizontal lines and statistical test as in b). (d) Boxplot and probability densities of focal TCGA and plasma samples for focal deletions (top) and for focal amplifications (bottom; Whiskers, horizontal lines and statistical test as in b). (e) Bar charts depicting the frequency of driver aberrations (green) and relative frequencies of the most frequently observed focal driver amplifications (red) and deletions (blue) in TCGA and plasma samples. (f) Co-occurrence of MYC amplification and TP53 losses in patients P19, P55, P119 and P148. Gains (log2-ratio>0.2) are shown in red and losses (log2-ratio less than −0.2) are shown in blue. Green indicates balanced regions.
Figure 3
Figure 3. Serial analyses revealed de novo occurrence of focal amplifications.
(a) Hierarchical clustering with serial plasma samples demonstrating that samples derived from the same patient tend to cluster together (Clustering-Manhattan average). (b) Genome-wide log2-ratio plots of plasma samples from P40 obtained at a castration-sensitive stage (upper panel) and 10 months later after development of CRPC. The inset illustrates enlarged log2-ratio plots of the X chromosome, the bottom sample shows gain of chromosome X material with the highest copy-number gain on Xq12, the region that harbours the AR gene. In this and in the subsequent panels, the grey arrows indicate the time intervals between the sample collections. Copy-number gains are depicted in red and copy-number losses in blue. (c) P106's tumour genome developed AR amplification within 12 months and an additional amplicon at Xq23-q24 within the subsequent 6 weeks. (d) The first plasma sample of P147 had two high-level amplifications, that is, on chromosomes Xq12 (AR) and 5q14.3 (EDIL3), which had not been observed in the primary tumour. Within the next 4 months, a further amplicon evolved on chromosome 10q11.21 (RET). The quality of the analysis of the primary tumour was not optimal due to the fixation conditions of the tissue. The ‘peak' on chromosome 10 in the primary tumour does not involve the RET region and is instead most likely an artefact. (e) The plasma sample from prostate cancer patient P112 displayed an amplicon on 1q21.3 including SETDB1, which had not been present in the analysed part of the primary tumour.
Figure 4
Figure 4. Changing proportions of SCNAs associated with increasing NSE.
(a) Genome-wide log2-ratio plots of plasma samples P148_1 (upper panel) and P148_3 (centre panel), which was obtained 12 months later. Between these two samples, relative copy-number losses and gains for ∼42.2% and ∼23.3%, respectively, of chromosomal regions (overlay plots in bottom panel; black: first analysis (P148_1); blue: third analysis (P148_3) were observed; regions with different log2-ratios >0.2 are marked with blue and red bars below or above the respective regions). (b) Enlarged X-chromosome profiles demonstrating that the AR amplification is only present in sample P148_1. (c) Confirmation of the AR copy-number status by quantitative PCR in duplicates. Y axis represents RQ (relative quantity) compared with a pooled male reference DNA sample; error bars indicate minimum and maximum values. (d) Plots of P170 illustrating changing chromosomal copy-number patterns over a period of 15 weeks (black: first analysis (P170_1); blue: second analysis (P170_2)). Between the two analyses 26.7% of the genome differs in terms of copy-number status (235 and 590 Mb were gained or lost, respectively, in P170_2 compared with P170_1). Log2-ratios of sample P170_1 have been adjusted to correct for different tumour ratios. Estimated tumour DNA content ratio: 1:4.34 (P170_1/P170_4). (e) Comparison between first and last analysed plasma samples from P179 (black: first analysis (P179_1); blue: second analysis (P179_4)). These analyses do not show major changes on the autosomes, but do show loss of the AR amplicon (indicated as blue bar below the X chromosome).

References

    1. Barbieri C. E. & Tomlins S. A. The prostate cancer genome: perspectives and potential. Urol. Oncol. 32, 53.e15–53.e22 (2014). - PubMed
    1. Baca S. C. et al.. Punctuated evolution of prostate cancer genomes. Cell 153, 666–677 (2013). - PMC - PubMed
    1. Barbieri C. E. et al.. Exome sequencing identifies recurrent SPOP, FOXA1 and MED12 mutations in prostate cancer. Nat. Genet. 44, 685–689 (2012). - PMC - PubMed
    1. Berger M. F. et al.. The genomic complexity of primary human prostate cancer. Nature 470, 214–220 (2011). - PMC - PubMed
    1. Grasso C. S. et al.. The mutational landscape of lethal castration-resistant prostate cancer. Nature 487, 239–243 (2012). - PMC - PubMed

Publication types