. 2016 Jun 21;4(1):28.
doi: 10.1186/s40168-016-0175-0.

Adjusting microbiome profiles for differences in microbial load by spike-in bacteria

Affiliations

Adjusting microbiome profiles for differences in microbial load by spike-in bacteria

Frank Stämmler et al. Microbiome. .

Abstract

Background: Next-generation 16S ribosomal RNA gene sequencing is widely used to determine the relative composition of the mammalian gut microbiomes. However, in the absence of a reference, this does not reveal alterations in absolute abundance of specific operational taxonomic units if microbial loads vary across specimens.

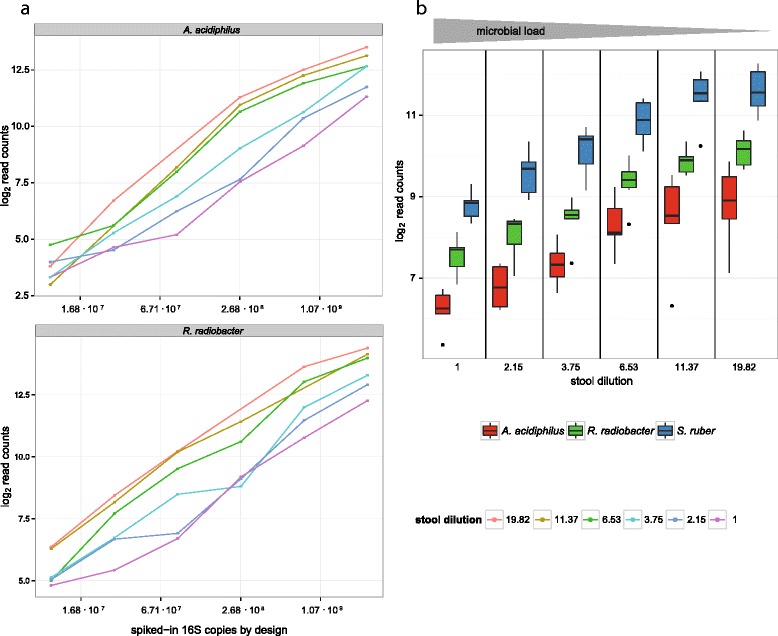
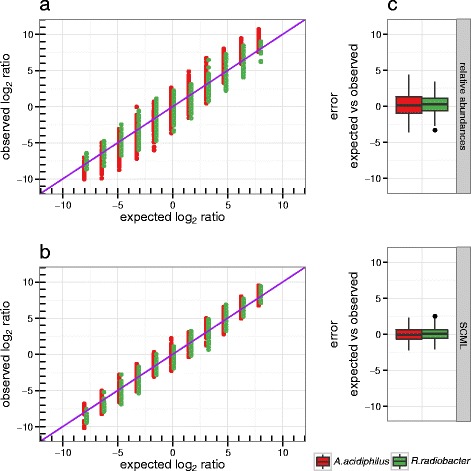
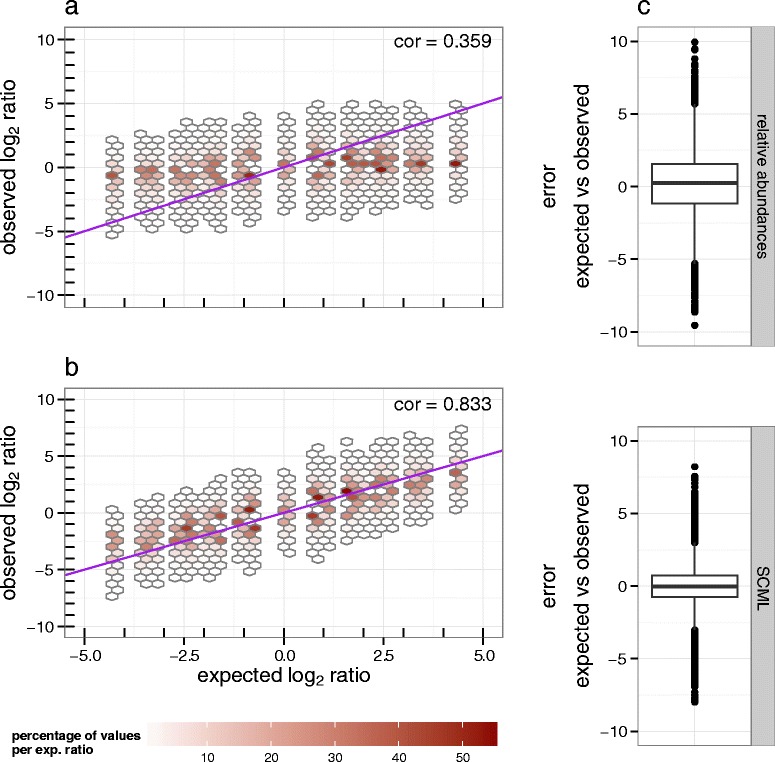
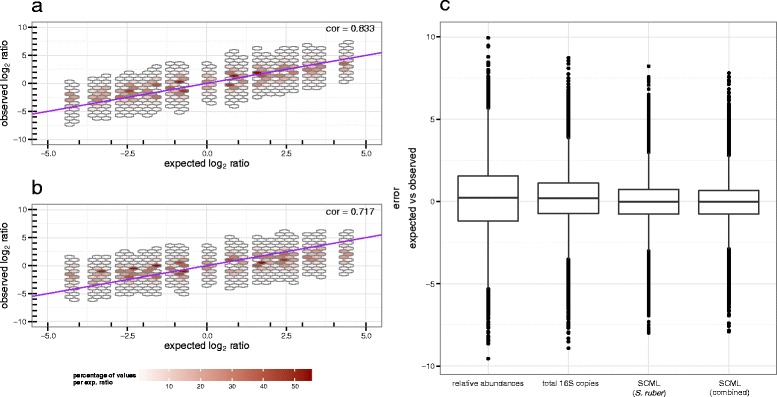
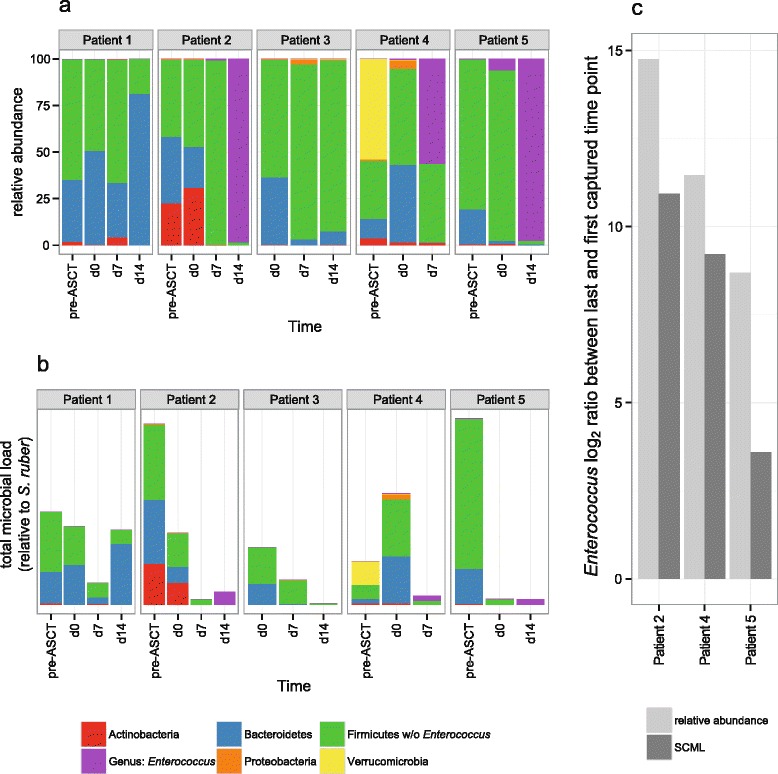
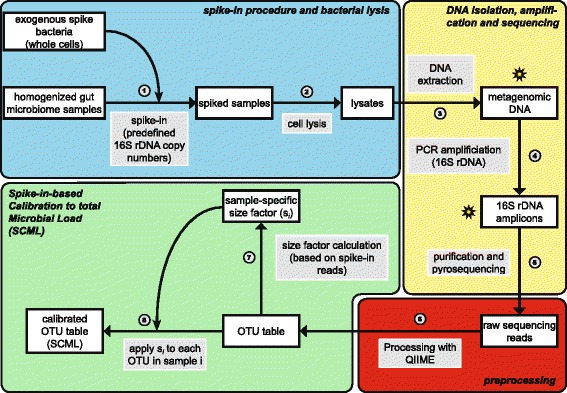
Results: Here we suggest the spiking of exogenous bacteria into crude specimens to quantify ratios of absolute bacterial abundances. We use the 16S rDNA read counts of the spike-in bacteria to adjust the read counts of endogenous bacteria for changes in total microbial loads. Using a series of dilutions of pooled faecal samples from mice containing defined amounts of the spike-in bacteria Salinibacter ruber, Rhizobium radiobacter and Alicyclobacillus acidiphilus, we demonstrate that spike-in-based calibration to microbial loads allows accurate estimation of ratios of absolute endogenous bacteria abundances. Applied to stool specimens of patients undergoing allogeneic stem cell transplantation, we were able to determine changes in both relative and absolute abundances of various phyla, especially the genus Enterococcus, in response to antibiotic treatment and radio-chemotherapeutic conditioning.

Conclusion: Exogenous spike-in bacteria in gut microbiome studies enable estimation of ratios of absolute OTU abundances, providing novel insights into the structure and the dynamics of intestinal microbiomes.

Keywords: 16S rRNA gene sequencing; Bacterial communities; Community analysis; Microbial load; Microbiome profiling; Spike-in bacteria; Standardization.


Figures

Fig. 1
Fig. 1
Log2 transformed read counts of the three spike-in bacteria as a function of total microbial load. S. ruber was added at a constant number of 16S rDNA copies, while A. acidiphilus and R. radiobacter were spiked in variably (cf. Additional file 2: Table S2). a Resulting read counts of A. acidiphilus and R. radiobacter versus spiked-in 16S rDNA copies at different background stool microbiota dilutions. Each dot represents a caecal specimen, while the colour specifies its dilution. b Boxplots showing the read counts of all three spike-in bacteria as a function of total microbial load. The log2 read counts of S. ruber are coloured blue, while A. acidiphilus and R. radiobacter are coloured red and green, respectively. Read counts of A. acidiphilus and R. radiobacter were adjusted by a factor corresponding to their difference of the predefined spike-in concentration to S. ruber. The x-axis is discrete and represents increasing stool dilution (bottom), as well as decreasing microbial load from left to right (grey arrowhead on the top)
Fig. 2
Fig. 2
Comparison of log2 ratios derived from relative abundances and after applying SCML to A. acidiphilus and R. radiobacter. Observed log2 ratios versus expected log2 ratios of the spike-ins A. acidiphilus and R. radiobacter as derived from (a) relative abundances and (b) SCML by S. ruber for all pairwise sample comparisons. Both approaches were performed on the raw, not adjusted read counts of A. acidiphilus and R. radiobacter. The expected log2 ratios are calculated by the theoretical number of 16S rDNA copies predetermined in the design of the validation experiment (cf. Additional file 2: Table S2). The purple diagonal represents the identity, which represents the expected log2 ratios by design. The box plots in (c) show the error between the expected and observed log2 ratios for both approaches. The smaller this error, the better calibrated the ratios are
Fig. 3
Fig. 3
Comparison of log2 ratios derived from relative abundances and after applying SCML to all background OTUs. Observed log2 ratio versus expected log2 ratio of all background OTUs for all pairwise comparisons as derived from (a) relative abundances and (b) SCML by S. ruber. The data is binned to hexagons because of the high number of data points. The colour of each hexagon represents the percentage of counts at the corresponding level of expected log2 ratios contained in each bin. Bins that contributed to <0.05 % for each level of expected log2 ratio are omitted. The purple diagonal represents the identity, which represents the expected log2 ratios by design. The box-plots in (c) show the error between the expected and observed log2 ratios for both approaches. The smaller this error, the better calibrated the ratios are
Fig. 4
Fig. 4
Comparison of SCML and normalization by qRT-PCR-derived total number of 16S rDNA copies to all background OTUs. Observed log2 ratio versus expected log2 ratio of all background bacteria OTUs for all pairwise sample comparisons after (a) SCML by S. ruber and (b) normalization by qRT-PCR derived total 16S rDNA copy number. The data is binned to hexagons because of the high number of data points. The colour of each hexagon represents the percentage of all counts at the corresponding level of expected log2 ratios contained in each bin. Bins that contributed to less than 0.05 percent for each level of expected log2 ratio are omitted. The purple diagonal represents the identity, which represents the expected log2 ratios by design. The box-plots in (c) summarize the error between the expected and observed log2 ratios for the four different approaches. The smaller this error, the better calibrated the ratios are. Variances of the log2 differences are 3.65, 2.01, 1.28 and 1.18 as derived from relative abundances, counts calibrated for differences in total number of 16S rRNA gene copies, SCML (by S. ruber) and combined SCML (by S. ruber, A. acidiphilus and R. radiobacter), respectively
Fig. 5
Fig. 5
Bacterial abundances in stool specimens of ASCT patients. Specimens were collected prior to administration of prophylactic antibiotics and radio-chemotherapeutic conditioning (pre-ASCT) and on days 0, 7 and 14 after ASCT (d0, d7, d14). a Microbial composition given as in relative abundances; (b) read counts scaled to a uniform count of the spike-in S. ruber and (c) log2 ratios of Enterococcus of the last time point to pre-ASCT of patients 2, 4 and 5 as derived from relative abundances (light grey) and SCML (dark grey). In (a) and (b) the reads of the three spike-in bacteria are omitted. Additionally, the reads that contributed to the genus of Enterococcus are excluded from the Firmicutes phylum and coloured separately (purple)
Fig. 6
Fig. 6
Procedural overview of proposed spike-in procedure and the spike-in-based calibration to total microbial load (SCML). The overview is divided into four sections: spike-in procedure and bacterial lysis (blue), DNA isolation, amplification and sequencing (yellow), pre-processing (red) and the actual spike-in-based calibration to microbial load (green). White-filled boxes depict procedural intermediates, while grey-filled boxes depict the different procedural steps. Each step is numbered. In the first step (1) whole cells of exogenous spike bacteria corresponding to a fixed number of 16S rDNA copies are added to homogenized microbiome samples. Bacterial lysis is performed on the resulting spiked samples (2). Metagenomic DNA is extracted from the lysates (3) and PCR amplified using 16S rDNA specific primers (4), creating 16S rDNA amplicons. These amplicons are purified and pyrosequencing is performed (5). The resulting raw read counts are pre-processed with QIIME (quality filtering, demultiplexing and closed reference OTU picking) to generate OTU read count tables (6). Based on the read counts associated with single or multiple reference spike-in bacteria, a size factor si for each sample i is calculated and applied to each OTU of this particular sample i (8, see methods section). This leads to an OTU read count table calibrated to differences in microbial load. These read counts can be utilized to more accurately assess changes between different samples. All depicted steps are described in detail in the methods section. Stars indicate points in the procedure at which qPCR is performed to identify possible errors in DNA isolation (metagenomic DNA) or PCR amplification (16S rDNA amplicons).

References

    1. Walker A, Pfitzner B, Neschen S, Kahle M, Harir M, Lucio M, et al. Distinct signatures of host-microbial meta-metabolome and gut microbiome in two C57BL/6 strains under high-fat diet. ISME J. 2014;8(12):2380–96. doi: 10.1038/ismej.2014.79. - DOI - PMC - PubMed
    1. Buffie CG, Pamer EG. Microbiota-mediated colonization resistance against intestinal pathogens. Nat Rev Immunol. 2013;13(11):790–801. doi: 10.1038/nri3535. - DOI - PMC - PubMed
    1. Chung H, Pamp SJ, Hill JA, Surana NK, Edelman SM, Troy EB, et al. Gut immune maturation depends on colonization with a host-specific microbiota. Cell. 2012;149(7):1578–93. doi: 10.1016/j.cell.2012.04.037. - DOI - PMC - PubMed
    1. Haberman Y, Tickle TL, Dexheimer PJ, Kim MO, Tang D, Karns R, et al. Pediatric Crohn disease patients exhibit specific ileal transcriptome and microbiome signature. J Clin Invest. 2014;124(8):3617–33. doi: 10.1172/JCI75436. - DOI - PMC - PubMed
    1. Kostic AD, Xavier RJ, Gevers D. The microbiome in inflammatory bowel disease: current status and the future ahead. Gastroenterology. 2014;146(6):1489–99. doi: 10.1053/j.gastro.2014.02.009. - DOI - PMC - PubMed

Publication types