

PEDLA: predicting enhancers with a deep learning-based algorithmic framework
- PMID: 27329130
- PMCID: PMC4916453
- DOI: 10.1038/srep28517
PEDLA: predicting enhancers with a deep learning-based algorithmic framework
Abstract
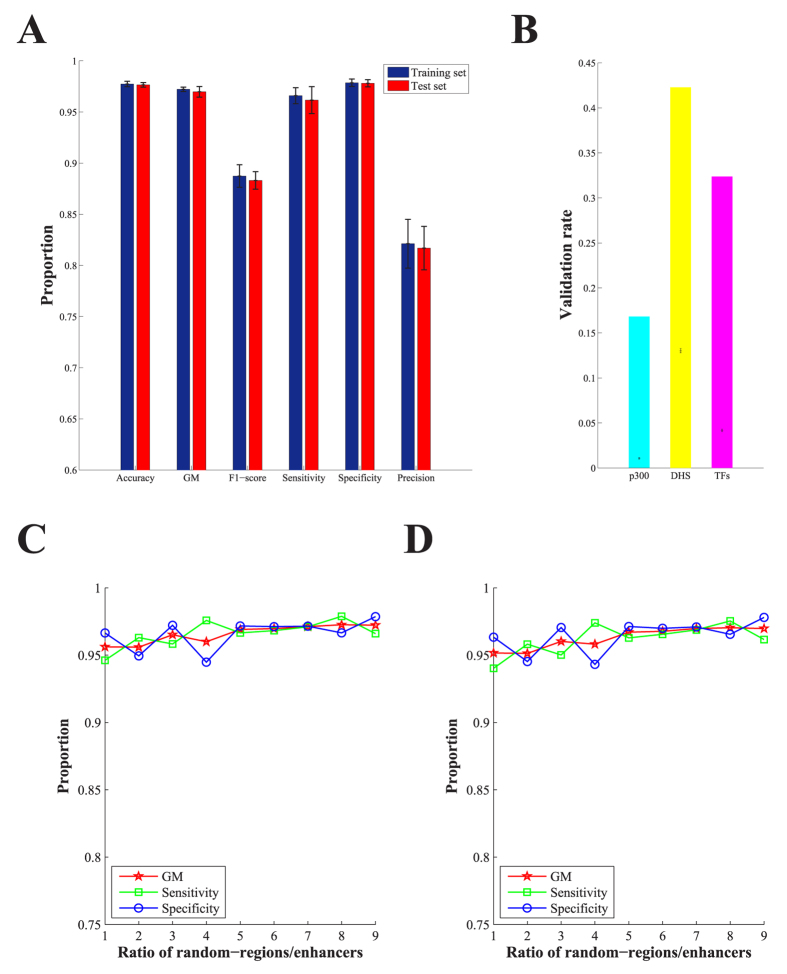
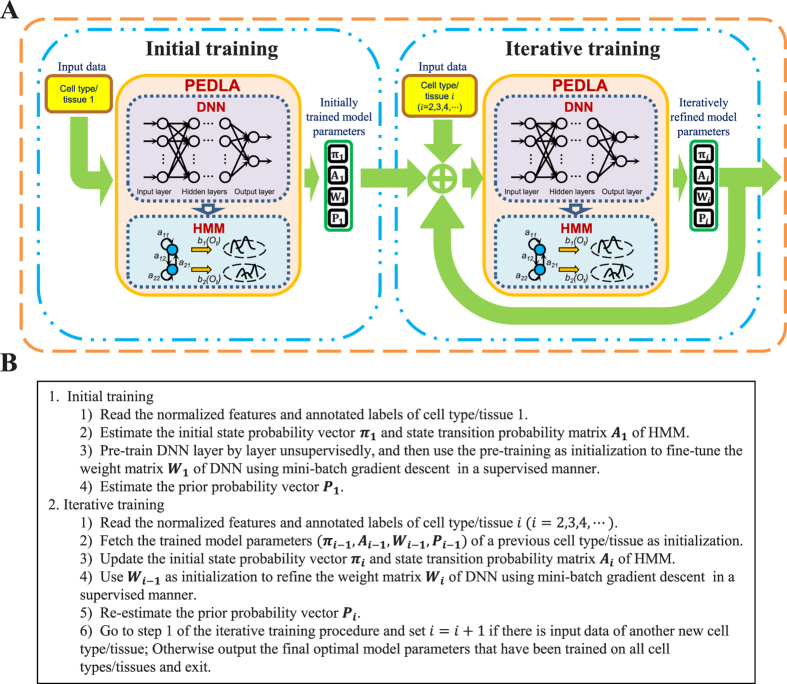
Transcriptional enhancers are non-coding segments of DNA that play a central role in the spatiotemporal regulation of gene expression programs. However, systematically and precisely predicting enhancers remain a major challenge. Although existing methods have achieved some success in enhancer prediction, they still suffer from many issues. We developed a deep learning-based algorithmic framework named PEDLA (https://github.com/wenjiegroup/PEDLA), which can directly learn an enhancer predictor from massively heterogeneous data and generalize in ways that are mostly consistent across various cell types/tissues. We first trained PEDLA with 1,114-dimensional heterogeneous features in H1 cells, and demonstrated that PEDLA framework integrates diverse heterogeneous features and gives state-of-the-art performance relative to five existing methods for enhancer prediction. We further extended PEDLA to iteratively learn from 22 training cell types/tissues. Our results showed that PEDLA manifested superior performance consistency in both training and independent test sets. On average, PEDLA achieved 95.0% accuracy and a 96.8% geometric mean (GM) of sensitivity and specificity across 22 training cell types/tissues, as well as 95.7% accuracy and a 96.8% GM across 20 independent test cell types/tissues. Together, our work illustrates the power of harnessing state-of-the-art deep learning techniques to consistently identify regulatory elements at a genome-wide scale from massively heterogeneous data across diverse cell types/tissues.
Figures
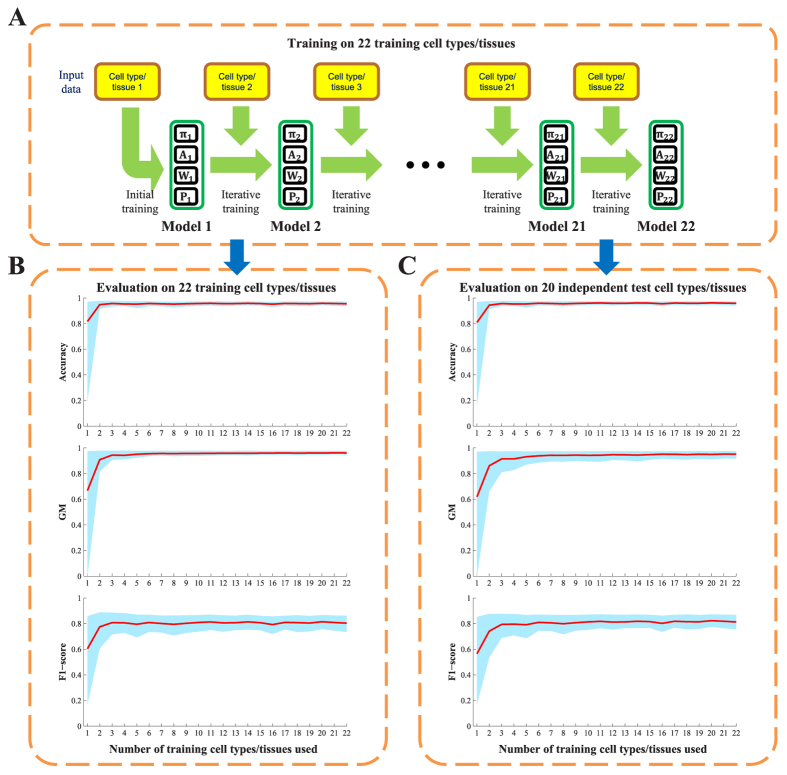
 (1 ≤ j ≤ 22,1 ≤ i ≤ 200) denotes the optimal model that finished training on the j-th training cell type/tissue in the i-th run of the 200 independent runs. (B,C) Performance evaluations of PEDLA in the training cell set and the independent test cell set along the training route. Three performance indicators, accuracy, GM, and F1-score, were assessed for the PEDLA with the trained optimal model in the 22 training cell types/tissues and 20 test cell types/tissues, independently. (B) For a fixed j of the X-axis, all 200 optimal models
  (1 ≤ i ≤ 200) were used to assess the performance indicators on the 22 training cell types/tissues. The red line represents the mean of the total 200 × 22 = 4,400 values of each performance indicator, and the light blue colour band indicates the 10th and 90th percentiles. (C) For a fixed j of the X-axis, all 200 optimal models
  (1 ≤ i ≤ 200) were used to assess the performance indicators on the 20 test cell types/tissues. The red line represents the mean of the total 200 × 20 = 4,000 values of each performance indicator, and the light blue colour band indicates the 10th and 90th percentiles.
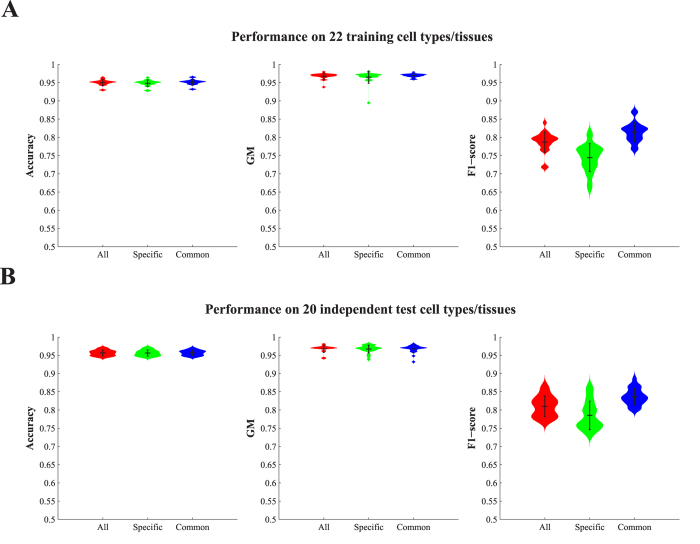
 (1 ≤ i ≤ 200) that finished training on 22 training cell types/tissues. All enhancers were classified as “specific” or “common” based on the number of cell types/tissues in which the enhancers occurred. An enhancer that occurred in not more than 4 cell types/tissues was termed specific; otherwise, it was considered common.
Similar articles
-
DEEP: a general computational framework for predicting enhancers.Nucleic Acids Res. 2015 Jan;43(1):e6. doi: 10.1093/nar/gku1058. Epub 2014 Nov 5. Nucleic Acids Res. 2015. PMID: 25378307 Free PMC article.
-
SeqEnhDL: sequence-based classification of cell type-specific enhancers using deep learning models.BMC Res Notes. 2021 Mar 19;14(1):104. doi: 10.1186/s13104-021-05518-7. BMC Res Notes. 2021. PMID: 33741075 Free PMC article.
-
BiRen: predicting enhancers with a deep-learning-based model using the DNA sequence alone.Bioinformatics. 2017 Jul 1;33(13):1930-1936. doi: 10.1093/bioinformatics/btx105. Bioinformatics. 2017. PMID: 28334114
-
Demystifying the secret mission of enhancers: linking distal regulatory elements to target genes.Crit Rev Biochem Mol Biol. 2015;50(6):550-73. doi: 10.3109/10409238.2015.1087961. Epub 2015 Oct 8. Crit Rev Biochem Mol Biol. 2015. PMID: 26446758 Free PMC article. Review.
-
The identification of cis-regulatory elements: A review from a machine learning perspective.Biosystems. 2015 Dec;138:6-17. doi: 10.1016/j.biosystems.2015.10.002. Epub 2015 Oct 21. Biosystems. 2015. PMID: 26499213 Review.
Cited by
-
Pig-eRNAdb: a comprehensive enhancer and eRNA dataset of pigs.Sci Data. 2024 Feb 1;11(1):157. doi: 10.1038/s41597-024-02960-7. Sci Data. 2024. PMID: 38302497 Free PMC article.
-
Deep learning approaches for noncoding variant prioritization in neurodegenerative diseases.Front Aging Neurosci. 2022 Nov 18;14:1027224. doi: 10.3389/fnagi.2022.1027224. eCollection 2022. Front Aging Neurosci. 2022. PMID: 36466610 Free PMC article. Review.
-
Exploiting regulatory heterogeneity to systematically identify enhancers with high accuracy.Proc Natl Acad Sci U S A. 2019 Jan 15;116(3):900-908. doi: 10.1073/pnas.1808833115. Epub 2018 Dec 31. Proc Natl Acad Sci U S A. 2019. PMID: 30598455 Free PMC article.
-
Genome-wide prediction of cis-regulatory regions using supervised deep learning methods.BMC Bioinformatics. 2018 May 31;19(1):202. doi: 10.1186/s12859-018-2187-1. BMC Bioinformatics. 2018. PMID: 29855387 Free PMC article.
-
Regulatory elements in molecular networks.Wiley Interdiscip Rev Syst Biol Med. 2017 May;9(3):10.1002/wsbm.1374. doi: 10.1002/wsbm.1374. Epub 2017 Jan 17. Wiley Interdiscip Rev Syst Biol Med. 2017. PMID: 28093886 Free PMC article. Review.
References
-
- Bonn S. et al.. Tissue-specific analysis of chromatin state identifies temporal signatures of enhancer activity during embryonic development. Nat Genet 44, 148–156 (2012). - PubMed
Publication types
LinkOut - more resources
Full Text Sources
Other Literature Sources
