

Neuroanatomical and neurofunctional markers of social cognition in autism spectrum disorder
- PMID: 27329401
- PMCID: PMC5053857
- DOI: 10.1002/hbm.23288
Neuroanatomical and neurofunctional markers of social cognition in autism spectrum disorder
Abstract
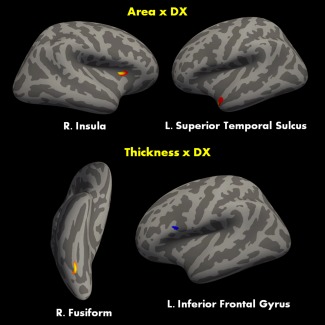
Social impairments in autism spectrum disorder (ASD), a hallmark feature of its diagnosis, may underlie specific neural signatures that can aid in differentiating between those with and without ASD. To assess common and consistent patterns of differences in brain responses underlying social cognition in ASD, this study applied an activation likelihood estimation (ALE) meta-analysis to results from 50 neuroimaging studies of social cognition in children and adults with ASD. In addition, the group ALE clusters of activation obtained from this was used as a social brain mask to perform surface-based cortical morphometry (SBM) in an empirical structural MRI dataset collected from 55 ASD and 60 typically developing (TD) control participants. Overall, the ALE meta-analysis revealed consistent differences in activation in the posterior superior temporal sulcus at the temporoparietal junction, middle frontal gyrus, fusiform face area (FFA), inferior frontal gyrus (IFG), amygdala, insula, and cingulate cortex between ASD and TD individuals. SBM analysis showed alterations in the thickness, volume, and surface area in individuals with ASD in STS, insula, and FFA. Increased cortical thickness was found in individuals with ASD, the IFG. The results of this study provide functional and anatomical bases of social cognition abnormalities in ASD by identifying common signatures from a large pool of neuroimaging studies. These findings provide new insights into the quest for a neuroimaging-based marker for ASD. Hum Brain Mapp 37:3957-3978, 2016. © 2016 Wiley Periodicals, Inc.
Keywords: activation likelihood estimation; autism; brain; meta-analysis; neuroimaging; social brain; social cognition.
© 2016 Wiley Periodicals, Inc.
Figures

Similar articles
-
Hemispheric differences in language processing in autism spectrum disorders: A meta-analysis of neuroimaging studies.Autism Res. 2016 Oct;9(10):1046-1057. doi: 10.1002/aur.1599. Epub 2016 Jan 11. Autism Res. 2016. PMID: 26751141
-
Social brain dysfunctionality in individuals with autism spectrum disorder and their first-degree relatives: An activation likelihood estimation meta-analysis.Psychiatry Res Neuroimaging. 2020 Apr 30;298:111063. doi: 10.1016/j.pscychresns.2020.111063. Epub 2020 Mar 5. Psychiatry Res Neuroimaging. 2020. PMID: 32179248
-
Speech perception in autism spectrum disorder: An activation likelihood estimation meta-analysis.Behav Brain Res. 2018 Feb 15;338:118-127. doi: 10.1016/j.bbr.2017.10.025. Epub 2017 Oct 23. Behav Brain Res. 2018. PMID: 29074403
-
[Social cognition in schizophrenia and autism spectrum disorder: Points of convergence and functional differences].Encephale. 2018 Dec;44(6):523-537. doi: 10.1016/j.encep.2018.03.004. Epub 2018 Aug 16. Encephale. 2018. PMID: 30122298 Review. French.
-
Meta-analytic connectivity modelling of functional magnetic resonance imaging studies in autism spectrum disorders.Brain Imaging Behav. 2023 Apr;17(2):257-269. doi: 10.1007/s11682-022-00754-2. Epub 2023 Jan 12. Brain Imaging Behav. 2023. PMID: 36633738 Free PMC article. Review.
Cited by
-
Deep learning based joint fusion approach to exploit anatomical and functional brain information in autism spectrum disorders.Brain Inform. 2024 Jan 9;11(1):2. doi: 10.1186/s40708-023-00217-4. Brain Inform. 2024. PMID: 38194126 Free PMC article.
-
One hand, two hands, two people: Prospective sensorimotor control in children with autism.Dev Cogn Neurosci. 2018 Jan;29:86-96. doi: 10.1016/j.dcn.2017.02.009. Epub 2017 Mar 2. Dev Cogn Neurosci. 2018. PMID: 28292645 Free PMC article.
-
Adaptive Whole-Brain Dynamics Predictive Method: Relevancy to Mental Disorders.Research (Wash D C). 2025 Apr 5;8:0648. doi: 10.34133/research.0648. eCollection 2025. Research (Wash D C). 2025. PMID: 40190349 Free PMC article.
-
Associations Among Maternal Metabolic Conditions, Cord Serum Leptin Levels, and Autistic Symptoms in Children.Front Psychiatry. 2022 Feb 3;12:816196. doi: 10.3389/fpsyt.2021.816196. eCollection 2021. Front Psychiatry. 2022. PMID: 35185642 Free PMC article.
-
Social Cognition Dysfunctions in Neurodegenerative Diseases: Neuroanatomical Correlates and Clinical Implications.Behav Neurol. 2018 Apr 26;2018:1849794. doi: 10.1155/2018/1849794. eCollection 2018. Behav Neurol. 2018. PMID: 29854017 Free PMC article. Review.
References
-
- Adolphs R (2001): The neurobiology of social cognition. Curr Opin Neurobiol 11:231–239. - PubMed
-
- Ashwin C, Baron‐Cohen S, Wheelwright S, O'Riordan M, Bullmore ET (2007): Differential activation of the amygdala and the “social brain” during fearful face‐processing in Asperger Syndrome. Neuropsychologia 45:2–14. - PubMed
-
- Baron‐Cohen S, Ring HA, Bullmore ET, Wheelwright S, Ashwin C, Williams SC (2000): The amygdala theory of autism. Neurosci Biobehav Rev 24:355–364. - PubMed
-
- Baron‐Cohen S, Ring HA, Wheelwright S, Bullmore ET, Brammer MJ, Simmons A, Williams SC (1999): Social intelligence in the normal and autistic brain: An fMRI study. Eur J Neurosci 11:1891–1898. - PubMed
Publication types
MeSH terms
Grants and funding
LinkOut - more resources
Full Text Sources
Other Literature Sources
Medical
