

Skeletal Metabolism, Fracture Risk, and Fracture Outcomes in Type 1 and Type 2 Diabetes
- PMID: 27329951
- PMCID: PMC4915586
- DOI: 10.2337/db16-0063
Skeletal Metabolism, Fracture Risk, and Fracture Outcomes in Type 1 and Type 2 Diabetes
Abstract
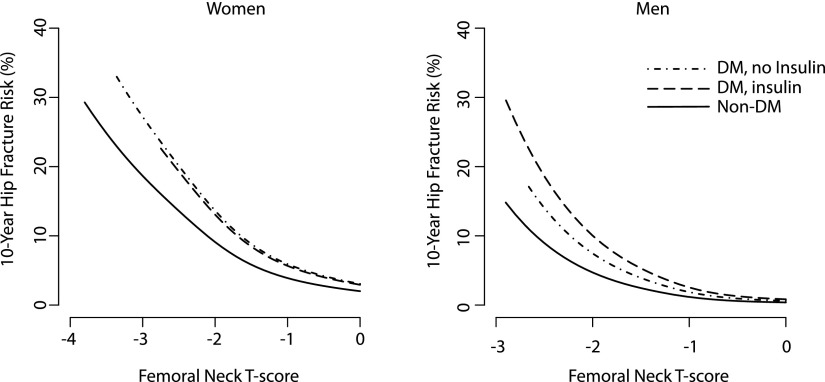
Fracture risk is significantly increased in both type 1 and type 2 diabetes, and individuals with diabetes experience worse fracture outcomes than normoglycemic individuals. Factors that increase fracture risk include lower bone mass in type 1 diabetes and compromised skeletal quality and strength despite preserved bone density in type 2 diabetes, as well as the effects of comorbidities such as diabetic macro- and microvascular complications. In this Perspective, we assess the developing scientific knowledge regarding the epidemiology and pathophysiology of skeletal fragility in patients with diabetes and the emerging data on the prediction, treatment, and outcomes of fractures in individuals with type 1 and type 2 diabetes.
© 2016 by the American Diabetes Association. Readers may use this article as long as the work is properly cited, the use is educational and not for profit, and the work is not altered.
Figures
References
-
- Nguyen ND, Ahlborg HG, Center JR, Eisman JA, Nguyen TV. Residual lifetime risk of fractures in women and men. J Bone Miner Res 2007;22:781–788 - PubMed
-
- Burge R, Dawson-Hughes B, Solomon DH, Wong JB, King A, Tosteson A. Incidence and economic burden of osteoporosis-related fractures in the United States, 2005-2025. J Bone Miner Res 2007;22:465–475 - PubMed
-
- Bertram M, Norman R, Kemp L, Vos T. Review of the long-term disability associated with hip fractures. Inj Prev 2011;17:365–370 - PubMed
Publication types
MeSH terms
Grants and funding
LinkOut - more resources
Full Text Sources
Other Literature Sources
Medical
