. 2016 Jun 20:5:31655.
doi: 10.3402/jev.v5.31655. eCollection 2016.

Comparative analysis of EV isolation procedures for miRNAs detection in serum samples

Affiliations

Comparative analysis of EV isolation procedures for miRNAs detection in serum samples

Zoraida Andreu et al. J Extracell Vesicles. .

Abstract

Extracellular vesicles (EVs) are emerging as potent non-invasive biomarkers. However, current methodologies are time consuming and difficult to translate to clinical practice. To analyse EV-encapsulated circulating miRNA, we searched for a quick, easy and economic method to enrich frozen human serum samples for EV. We compared the efficiency of several protocols and commercial kits to isolate EVs. Different methods based on precipitation, columns or filter systems were tested and compared with ultracentrifugation, which is the most classical protocol to isolate EVs. EV samples were assessed for purity and quantity by nanoparticle tracking analysis and western blot or cytometry against major EV protein markers. For biomarker validation, levels of a set of miRNAs were determined in EV fractions and compared with their levels in total serum. EVs isolated with precipitation-based methods were enriched for a subgroup of miRNAs that corresponded to miRNAs described to be encapsulated into EVs (miR-126, miR-30c and miR-143), while the detection of miR-21, miR-16-5p and miR-19a was very low compared with total serum. Our results point to precipitation using polyethylene glycol (PEG) as a suitable method for an easy and cheap enrichment of serum EVs for miRNA analyses. The overall performance of PEG was very similar, or better than other commercial precipitating reagents, in both protein and miRNA yield, but in comparison to them PEG is much cheaper. Other methods presented poorer results, mostly when assessing miRNA by qPCR analyses. Using PEG precipitation in a longitudinal study with human samples, we demonstrated that miRNA could be assessed in frozen samples up to 8 years of storage. We report a method based on a cut-off value of mean of fold EV detection versus serum that provides an estimate of the degree of encapsulation of a given miRNA.

Keywords: biomarker; diagnosis; extracellular vesicles; microRNA; polyethylene glycol; serum.


Figures

Fig. 1
Fig. 1
Scheme of EV-enrichment protocols. Six different protocols were employed to enrich EVs from human serum: ultracentrifugation (UC), ExoQuick precipitation, total exosome isolation (TEI), PEG precipitation, ExoMir filtration and Exo-spin column.
Fig. 2
Fig. 2
Characterization of EV-enriched samples. (a) Nanoparticle tracking analysis measurements. A representative experiment in which 3 videos mean±SD recorded from each EV sample, isolated with the different protocols, are plotted. Concentration and mean particle size are also shown. (b) Protein analyses of EV samples. Lysates of EV enriched with the different protocols were assessed by WB for the presence of the EV markers Tsg101 and CD81. (c) Bead-assisted flow cytometry of EV samples obtained with the different protocols and stained for CD63. Data correspond to the mean±SEM of the mean fluorescence intensity for CD63 in 4 different donors. Negative control corresponds to EV-loaded beads stained only with secondary antimouse antibody.
Fig. 3
Fig. 3
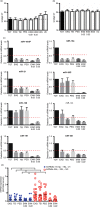
miRNA qPCR analysis in total serum and EVs isolated using different methods. Threshold cycle (Ct) values for the spike-in UniSp2 (a) and cel-mir-39-3 (b) in total serum samples (TOT), and EVs isolated by ExoQuick (EXQ), total exosome isolation (TEI), polyethylene glycol (PEG) and ExoMir (EXM). Serum samples were obtained from 10 healthy individuals, EVs were isolated from 250 µl of serum as indicated in Materials and Methods section. RNA was purified from EVs and total serum (250 µl); spike-in UniSp2 was added to each sample before RNA extraction while the spike-in cel-mir-39-3 was added before cDNA synthesis. (c) Levels of miRNAs (miR-19a, miR16-5p, miR-21, miR-30c, miR-126, miR-143, miR-191 and miR-451) detected in total serum and EVs isolated with EXQ, TEI, PEG and EXM. miRNAs levels were calculated using the comparative Ct method (ΔΔCt), where the total serum was used as the calibrator. In all cases, mean±SEM is indicated. (d) The EVs/total serum ratio of miRNAs. miRNAs are grouped according to the mean of miRNA levels in EV fractions with respect to total serum. Fold <0.3: filled blue circles and (miR-16-5p, miR-19a and miR-21); fold >0.5: empty red squares (miR-30c, miR-126 and miR-143). Differences between both groups of miRNAs were tested using Mann–Whitney U-test. Lines indicate means.
Fig. 4
Fig. 4
Levels of miRNAs detected in EVs isolated with EXQ, TEI and PEG. Box plot diagrams showing the levels of miRNAs in EVs isolated using precipitation methods (EXQ, TEI, PEG) from 10 healthy donors. miRNAs are classified according to detection in EVs vs. total serum, (a) miR-16-5p, miR-19a and miR-21 (fold<0.3), (b) miR-30c, miR-125 and miR-143 (fold>0.5) and (c) miR-191 and miR-451 (fold 0.4–0.5). miRNA levels were normalized to UniSp2. The line within the boxes indicated the mean, the top edge indicates the maximum and the bottom edge indicates the minimum value.
Fig. 5
Fig. 5
Longitudinal analyses of miRNA detection in total serum and EVs isolated by PEG from long-term stored sera collection. Threshold cycle (Ct) values for the spike-in UniSp2 (a) and cel-mir-39-3 (b) in total serum samples (Tot) and EVs isolated by polyethylene glycol (PEG). UniSp2 and cel-mir-39-3 were added to each sample before RNA isolation and RT reaction, respectively. Samples were classified according to the time storage: 13–14 years (n=3), 6–8 years (n=5) and 2–4 years (n=4). All samples remained frozen at −80°C until EVs and RNA purification. (c) Levels of miR-19a, miR-16-5p and miR-21 in total serum and EVs isolated with PEG. (d) Levels of miR-30c, miR-126 and miR-143 in total serum and EVs isolated with PEG. (e) Levels of miR-451 and miR-191 in total serum and EVs isolated with PEG. miRNAs levels were calculated using the comparative Ct method ΔCt=Ct miRNA-Ct UniSp2, and values correspond to 2-ΔCt. (f) Comparison of miRNA-16-5p and miR-19a detected in total serum and miR-30c and miR-126 levels detected in EVs fraction between samples frozen for 13–14 years and for 2–4 years. Bars correspond to the ratio: miRNA levels 13–14 years/miRNA levels 2–4 years; difference between groups was tested by Mann–Whitney U-test (p=0.01). In all cases, mean±SD is indicated.

References

    1. Negrini M, Nicoloso MS, Calin GA. MicroRNAs and cancer – new paradigms in molecular oncology. Curr Opin Cell Biol. 2009;21:470–9. - PubMed
    1. Reid G, Kirschner MB, van Zandwijk N. Circulating microRNAs: association with disease and potential use as biomarkers. Crit Rev Oncol Hematol. 2011;80:193–208. - PubMed
    1. Chen X, Ba Y, Ma L, Cai X, Yin Y, Wang K, et al. Characterization of microRNAs in serum: a novel class of biomarkers for diagnosis of cancer and other diseases. Cell Res. 2008;18:997–1006. - PubMed
    1. Bala S, Petrasek J, Mundkur S, Catalano D, Levin I, Ward J, et al. Circulating microRNAs in exosomes indicate hepatocyte injury and inflammation in alcoholic, drug-induced, and inflammatory liver diseases. Hepatology. 2012;56:1946–57. - PMC - PubMed
    1. Laterza OF, Lim L, Garrett-Engele PW, Vlasakova K, Muniappa N, Tanaka WK, et al. Plasma microRNAs as sensitive and specific biomarkers of tissue injury. Clin Chem. 2009;55:1977–83. - PubMed