. 2016 Jun 21;113(25):E3548-57.
doi: 10.1073/pnas.1518786113. Epub 2016 Jun 2.

Adaptable history biases in human perceptual decisions

Affiliations

Adaptable history biases in human perceptual decisions

Arman Abrahamyan et al. Proc Natl Acad Sci U S A. .

Abstract

When making choices under conditions of perceptual uncertainty, past experience can play a vital role. However, it can also lead to biases that worsen decisions. Consistent with previous observations, we found that human choices are influenced by the success or failure of past choices even in a standard two-alternative detection task, where choice history is irrelevant. The typical bias was one that made the subject switch choices after a failure. These choice history biases led to poorer performance and were similar for observers in different countries. They were well captured by a simple logistic regression model that had been previously applied to describe psychophysical performance in mice. Such irrational biases seem at odds with the principles of reinforcement learning, which would predict exquisite adaptability to choice history. We therefore asked whether subjects could adapt their irrational biases following changes in trial order statistics. Adaptability was strong in the direction that confirmed a subject's default biases, but weaker in the opposite direction, so that existing biases could not be eradicated. We conclude that humans can adapt choice history biases, but cannot easily overcome existing biases even if irrational in the current context: adaptation is more sensitive to confirmatory than contradictory statistics.

Keywords: bias adaptation; choice bias; choice history; computational modeling; decision making.


Conflict of interest statement

The authors declare no conflict of interest.

Figures
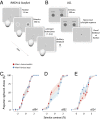
Fig. 1.
Fig. 1.
Task design and examples of psychometric functions biased by the previous choice. Subjects performed a two-alternative forced-choice discrimination of whether a sinusoidal grating presented against a gray background (A; RIKEN and Stanford subjects) or superimposed on visual noise (B; UCL) was to the left or right of fixation. (C–E) Examples of psychometric curves for three subjects sorted by whether the previous trial was a left (red) or right (blue) choice. Stimulus contrast (abscissa) is coded as positive for a stimulus on the right and negative for the left. Examples of subjects without any bias (C), a tendency to switch sides (D), and a tendency to stay (E) are depicted. In each case, a probabilistic choice model fitted to each subject’s data accurately fitted these effects (lines and shaded areas indicating 68% CIs). Error bars for the data are bootstrapped SEM.
Fig. 2.
Fig. 2.
Probabilistic choice model and statistical test for the role of choice history terms. (A) The probabilistic choice model represents choices as a linear sum of sensory evidence (contrast), choice history biases (successes and failure), and general L/R bias as predictors. Dashed boxes show example of predictors from one trial. Fitted weights of the model provide the estimate of the magnitude of influence of sensory and nonsensory terms rectified using the lapse rate (λ). The weighted sum can be transformed into choice probability using the logistic function. The model can then simulate trial-by-trial choices by “flipping the coin” using choice probability p. Modified with permission from ref. . (B) Proportion of runs for each subject for which the full model (blue) or no history model (red) provided better fits according to a likelihood ratio test.
Fig. 3.
Fig. 3.
Quantifying choice history biases. (A–C) Choice-history and contrast weights of probabilistic choice model averaged across subjects for data collected across diverse demographics at RIKEN (A), Stanford (B), and UCL (C). Error bars are bootstrapped SEM. (D) Success and failure biases of individual subjects colored according to whether subjects had (or were in the process of obtaining) a PhD (red, large dot is mean across these subjects) or not (orange). Example subjects from previous figures are indicated. Error bars are SEM.
Fig. 4.
Fig. 4.
Bias-driven sensitivity loss. (A) Biases can significantly reduce visual sensitivity when comparing the slope of psychometric function from responses simulated with and without biases. Black circles show subjects with significant median decline in visual sensitivity (P < 0.01). Error bars are median bootstrapped 95% CI. (B) Sensitivity decline matrix shows simulated median loss in sensitivity as a function of choice history biases using average sensory weights across all subjects. Each grid point shows the median decline in sensitivity over 200 simulation runs. Circles show individual mean biases.
Fig. 5.
Fig. 5.
Induced choice history biases. (A) Subject by subject choice history weights for experiments in which trial statistics were manipulated such that on 80% of trials stimulus presentation location was switched after a failure (○) or stayed on the same side (●). The gray arrow shows the mean group shift from origin to displacement. (B) Same conventions as A, but for when trial statistics were manipulated after successes.
Fig. 6.
Fig. 6.
Biases are easier to induce when they align with subject’s natural biases. Data from Fig. 5 are plotted for each condition against experimental runs in which trial order was completely randomized (○), which we use as a measure of subject’s natural bias. Subjects had a tendency for switch-after-failure and stay-after-success (gray arrows all begin in lower right quadrant). Inducing in this same direction (A and C) resulted in large adaptation effects, whereas inducing in the opposite direction (B and D) resulted in small if any changes. Gray arrows show the mean group shifts from origin to displacement. Plotting conventions similar to Fig. 5.

References

    1. Nowak M, Sigmund K. A strategy of win-stay, lose-shift that outperforms tit-for-tat in the Prisoner’s Dilemma game. Nature. 1993;364(6432):56–58. - PubMed
    1. Sutton SR, Barto AG. Reinforcement Learning. MIT Press; Cambridge, MA: 1998.
    1. Daw ND, Doya K. The computational neurobiology of learning and reward. Curr Opin Neurobiol. 2006;16(2):199–204. - PubMed
    1. Lau B, Glimcher PW. Dynamic response-by-response models of matching behavior in rhesus monkeys. J Exp Anal Behav. 2005;84(3):555–579. - PMC - PubMed
    1. Wang Z, Xu B, Zhou H-J. Social cycling and conditional responses in the Rock-Paper-Scissors game. Sci Rep. 2014;4:5830. - PMC - PubMed

Publication types

LinkOut - more resources