. 2016 Jun 21;9(433):ra62.
doi: 10.1126/scisignal.aaf5106.

MET signaling in keratinocytes activates EGFR and initiates squamous carcinogenesis

Affiliations

MET signaling in keratinocytes activates EGFR and initiates squamous carcinogenesis

Christophe Cataisson et al. Sci Signal. .

Abstract

The receptor tyrosine kinase MET is abundant in many human squamous cell carcinomas (SCCs), but its functional significance in tumorigenesis is not clear. We found that the incidence of carcinogen-induced skin squamous tumors was substantially increased in transgenic MT-HGF (mouse metallothionein-hepatocyte growth factor) mice, which have increased abundance of the MET ligand HGF. Squamous tumors also erupted spontaneously on the skin of MT-HGF mice that were promoted by wounding or the application of 12-O-tetradecanoylphorbol 13-acetate, an activator of protein kinase C. Carcinogen-initiated tumors had Ras mutations, but spontaneous tumors did not. Cultured keratinocytes from MT-HGF mice and oncogenic RAS-transduced keratinocytes shared phenotypic and biochemical features of initiation that were dependent on autocrine activation of epidermal growth factor receptor (EGFR) through increased synthesis and release of EGFR ligands, which was mediated by the kinase SRC, the pseudoproteases iRhom1 and iRhom2, and the metallopeptidase ADAM17. Pharmacological inhibition of EGFR caused the regression of MT-HGF squamous tumors that developed spontaneously in orthografts of MT-HGF keratinocytes combined with dermal fibroblasts and implanted onto syngeneic mice. The global gene expression profile in MET-transformed keratinocytes was highly concordant with that in RAS-transformed keratinocytes, and a core RAS/MET coexpression network was activated in precancerous and cancerous human skin lesions. Tissue arrays revealed that many human skin SCCs have abundant HGF at both the transcript and protein levels. Thus, through the activation of EGFR, MET activation parallels a RAS pathway to contribute to human and mouse cutaneous cancers.


Conflict of interest statement

Competing interests: The authors declare that they have no competing interests.

Figures

Fig.1:
Fig.1:. Responsiveness of WT, K5-PKCα, MT-HGF and DT mice to chemically-induced skin carcinogenesis.
(A) Breeding scheme and DMBA-TPA timeline; mice were initiated by topical application with 20μg DMBA/0.1mL acetone at day 4 after birth and promoted by treating with 1μg (1.6nmoles) TPA/0.2mL acetone twice a week from week 6 to 11. Tumors were counted every week. (B) Panel represents the percentage of mice with tumors. (C) Panel represents the mean number of skin tumors per tumor-bearing animal (mean ± SEM). WT (n=7), K5-PKCα (n=18), MT-HGF (n=14) and DT (n=9). Comparisons of DT and MT-HGF (*, p<0.05) and DT and K5-PKCα (*, p<0.05) were analyzed by Mann-Whitney U test. (D) TPA timeline in the absence of initiation, mice were promoted with 1μg (1.6nmoles) TPA/0.2mL acetone twice a week from weeks 6 to 16. (E) Tumor incidence at week 16. (F) Photograph of representative DT mice at week 16.
Fig. 2:
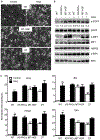
Fig. 2:. MT-HGF and DT keratinocytes exhibit activated MET and EGFR signaling.
Primary keratinocytes from wild-type (WT), K5-PKCa, MT-HGF and DT newborns were cultured in 0.05 mM Ca++ medium and transduced with v-rasHa for 3 days. (A) HGF and DT keratinocytes display a v-rasHa -keratinocyte like elongated morphology in the absence of RAS transduction. (B) total cell extract from primary keratinocytes untreated or transduced for 3 days with v-rasHa were analyzed by immunoblotting for phospho-MET, total MET, phospho-ERK and total ERK or phospho-EGFR, total EGFR and HSP90. Values below the phospho-EGFR blot represent the densitometric analysis of the phospho-EGFR/total EGFR ratio after normalization with HSP90 expression for input relative to non-RAS WT control. (C) real-time PCR analysis of amphiregulin (Areg), betacellulin (Btc), heparin-binding EGF-like growth factor (Hbegf), and transforming growth factor α (Tgfa) mRNA expression in control and v-rasHa-keratinocytes 3 days after transduction. Data shown are representative of three independent experiments, and bars represent the mean ± SEM of three replicates. **P < 0.01 vs. WT control. ***P < 0.001 vs. WT control.
Fig. 3:
Fig. 3:. MT-HGF and DT keratinocytes exhibit a RAS-like phenotype.
(A) Tritiated thymidine incorporation for 24 hours was measured in control and RAS-transduced WT, K5-PKCα, MT-HGF and DT keratinocyte cultures grown under proliferative (0.05 mM Ca++, left panel) or differentiating conditions (0.12 mM Ca++, right panel). Right panel = percent inhibition of thymidine incorporation compared to respective culture maintained under proliferative conditions. *P < 0.05, **P < 0.01, ***P < 0.001 vs. WT control. #P < 0.001 vs. WT RAS. (B) and (C) Total SDS cell extracts from control and RAS-transduced keratinocytes were immunoblotted with specific antibodies for the expression of Cyclin D1 and ACTIN (panel B) or (panel C) early markers of differentiation (K1 and K10) and simple epithelia marker (K8). SDS lysates were analyzed from 3-d post RAS transduction cultures that were switched to 0.12 mM Ca2+ media for an extra 24 h. (D) real-time PCR analysis of CXCL1 (Cxcl1), CXCL2 (Cxcl2), K1 (Krt1), K10 (Krt10), TNFα (Tnf), MMP9 (Mmp9), GM-CSF (Csf2), SLPI (Slpi) and IL-1α (Il1a) mRNA expression in control and RAS-keratinocytes 3 days after transduction. *P < 0.05, **P < 0.01, ***P < 0.001 vs. WT control. Bars represent the mean ± SEM of three replicates.
Fig. 4:
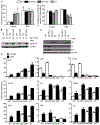
Fig. 4:. MET transactivates EGFR through ADAM17 mediated release of EGFR ligands.
Keratinocytes from MT-HGF mice were treated for 24h at confluence with (panel A and B) ADAM17 inhibitor (GM6001) or (panel C and G) siRNA targeting ADAM17 (Qiagen (5 and 6) or Dharmacon (Dhar.). (A) Amphiregulin (AREG) concentrations in culture supernatant. Bars are mean ± SEM of triplicate determinations. ***P < 0.001 vs. MT-HGF DMSO (0 uM). (B) and (C) Immunoblotting of cell extracts for phospho-EGFR, total EGFR, HSP 90 and ACTIN showing densitometric values for phospho-EGFR/total EGFR ratio normalized by HSP90 or ACTIN. Control is set to 1. (D) and (E) Keratinocytes from ADAM17fl/fl mice were cultured to confluence and transduced for 48h with control (Cont.) or Cre adenovirus and challenged with HGF for 6h (panel D) or 10 min. (panel E), AREG in culture supernatants and ADAM17 expression (insert) are shown in panel D. ***P < 0.001 vs control treated with HGF. (F) WT or RAS-keratinocytes were transduced with ADAM17-targeting siRNA for 48h and lysates were immunoblotted for phospho-EGFR, ADAM17, HSP 90. (G) Expression of signature transcripts (PCR) after ADAM17 siRNA transduction. **P < 0.01, ****P < 0.0001 vs. MT-HGF control. Bars represent the mean ± SEM of triplicate determinations.
Fig.5:
Fig.5:. MET activates SRC and iRhom to mediate the release of AREG.
(A) Total cell extract from primary keratinocytes treated for the indicated periods of time with HGF were analyzed by immunoblotting for pSRC, total SRC and HSP90. (B) Primary keratinocytes were cultured in 0.05 mM Ca++ medium to confluence and treated for 6h with HGF in the presence of siRNAs targeting Src (#1 to 4). AREG concentrations in culture supernatant and SRC/HSP90 expression (insert) are shown. *P < 0.05, ***P < 0.001 vs. Cont. HGF. (C) and (D), Primary keratinocytes were cultured in 0.05 mM Ca++ medium to confluence and treated for 6h with HGF in the presence of siRNAs targeting iRhom 1, iRhom2, Src and combinations thereof. Cells were harvested and both iRhom1 (Rhbdf1) and iRhom2 mRNAs (Rhbdf2) were quantified by real-time PCR (C) while AREG concentrations in culture supernatant was determined by ELISA (D). ***P < 0.001, ****P < 0.0001 vs control. Bars represent the mean ± SEM of quadruplicate determinations.
Fig. 6:
Fig. 6:. RAS-like phenotype and tumor development by HGF overexpressing keratinocytes is mediated by EGFR.
(A) Real-time PCR analysis of IL-1α (Il1a) and CXCL1 (Cxcl1) mRNA expression in WT and MT-HGF keratinocytes 3 days after adenoviral transduction with the NF-κB dominant-negative (IκBsr) adenovirus or treatment with the IL-1R antagonist (IL-1ra). #P < 0.001 vs. WT PBS. ***P < 0.001 vs. MT-HGF PBS. &P < 0.001 vs. MT-HGF Null Ad. (B) MT-HGF tumors from orthotopic grafts on MT-HGF host and MT-HGF normal skin were analyzed by immunoblotting for phospho-EGFR, phospho-ERK, total EGFR and HSP90. (C) and D, Six million MT-HGF keratinocytes were mixed respectively with 6 million MT-HGF primary dermal fibroblasts prior to grafting in the interscapular region of syngeneic hosts. Once squamous papillomas were clearly established, mice were treated daily by oral gavage with vehicle control or gefitinib at 100mg/kg for two weeks. (C) Waterfall plot of tumor response to gefitinib, data are expressed as % change of tumor volume after 2 weeks of treatment. (D) Representative photographs of orthotopic squamous papillomas at the start of the treatment (day 0) and termination (day 14).
Fig. 7:
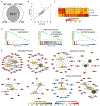
Fig. 7:. Identification of the model RAS/MET signature.
(A) Venn diagram depicting the number of differentially expressed genes in the MT-HGF and WT-RAS experiments (false discovery rate < 1%). (B) Scatter plot of the genes from the MT-HGF and WT-RAS overlapping signature (6247 genes); linear regression between the two experiments is shown by the solid black line (R2=0.77); 93% out of 6247 genes in the overlap are concordantly up- or down-regulated between the two experiments. (C) Heatmap visualization of estimated expression levels in 372 genes selected for the model RAS/MET signature (concordant, at least 2-fold change in both MT-HGF and WT-RAS); genes (columns) and samples (rows) are ordered by hierarchical clustering using Euclidean distance and complete linkage. (D) GSEA-enrichment plots are shown for top enriched gene sets in the model RAS/MET signature. The green line is the running enrichment score calculated along the ranked gene list represented by the red-blue horizontal bar (average t-statistic from MT-HGF and WT-RAS comparisons ranked from the highest positive to the highest negative value); the vertical black bars in the plot indicate the position of the genes from the respective GO terms, which are mostly situated within up-regulated genes. (E) GSEA-enrichment map for non-redundant and overlapping GO gene sets generated with REVIGO algorithm (SimRel < 0.9); Highly similar GO terms (3% of the strongest pairwise semantic similarities) are linked to each other with edges weighted by the semantic similarity; GO nodes are color-coded by the significance of enrichment (GSEA false discovery rate < 5%) and sized proportionally to the percentage of genes annotated to the term; in addition, unweighted edges connect genes from the model RAS/MET signature, which are also among the GSEA core genes (‘leading edge’), to the GO terms they are annotated to. The gene nodes are color-coded by the average difference in expression of MT-HGF and WT-RAS versus WT-Control. See Supplementary Table 2 for detailed statistical results of GSEA analysis.
Fig. 8:
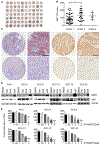
Fig. 8:. MET is highly expressed in human cutaneous SCC.
(A) Human skin squamous cell cancer tissue array was immunostained with anti-MET antibody and visualized by bright-field microscopy. (B) Quantification of the epithelial compartment staining intensity using the Aperio software ImageScope according to tumor grade. Grade1 (n=49), grade 2 (n=20) grade 3 (n=5). *P < 0.05 vs. grade1. (C) RNA in situ and protein IHC in human squamous cell carcinomas. RNA in situ signal (red) deconvoluted with Aperio ScanScope algorithm and pseudo-colored with Adobe imaging software. Bar = 200 μm. Both positive and negative tumors are shown for ISH and IHC. (D) Human SCC cell lines were grown to confluence and treated for 24h with DMSO, Capmatinib (Cap.), PHA665752 (PHA) or recombinant HGF. Total cell extracts were analyzed by immunoblotting for phospho-MET, total MET and HSP 90 (D) and in separate vessels tritiated-thymidine incorporation was measured (E). *P < 0.05, **P < 0.01, ***P < 0.00,1 ***P < 0.001, ****P < 0.0001 vs control (0). Bars represent the mean ± SEM value of quadruplicates.
Fig. 9:
Fig. 9:. Evaluation of activity of the model RAS/MET signature in cancer patients.
(A) Predicted DART scores of the signature activity level in patient-matched samples (GSE32979, N=13) from normal epidermis (NE), actinic keratosis (AK) and squamous-cell carcinoma (SCC). (B) Predicted DART scores of the signature levels in patients and healthy controls (combined data from GSE2505 and GSE42677; normal epidermis (NE), 16 samples; actinic keratosis (AK), 9 samples; squamous-cell carcinoma (SCC), 15 samples).

References

    1. Rundhaug JE, and Fischer SM. Molecular mechanisms of mouse skin tumor promotion. Cancers (Basel). 2010;2(2):436–82. - PMC - PubMed
    1. Coussens LM, and Werb Z. Inflammation and cancer. Nature. 2002;420(6917):860–7. - PMC - PubMed
    1. Mueller MM. Inflammation in epithelial skin tumours: old stories and new ideas. EurJCancer. 2006;42(6):735–44. - PubMed
    1. Johansson M, Denardo DG, and Coussens LM. Polarized immune responses differentially regulate cancer development. Immunol Rev. 2008;222(145–540). - PMC - PubMed
    1. Cataisson C, Ohman R, Patel G, Pearson A, Tsien M, Jay S, Wright L, Hennings H, and Yuspa SH. Inducible cutaneous inflammation reveals a protumorigenic role for keratinocyte CXCR2 in skin carcinogenesis. Cancer Res. 2009;69(1):319–28. - PMC - PubMed

MeSH terms