

Relationship of white and gray matter abnormalities to clinical and genetic features in myotonic dystrophy type 1
- PMID: 27330968
- PMCID: PMC4900512
- DOI: 10.1016/j.nicl.2016.04.012
Relationship of white and gray matter abnormalities to clinical and genetic features in myotonic dystrophy type 1
Abstract
Background: Myotonic dystrophy type 1 (DM1) represents a multisystemic disorder in which diffuse brain white and gray matter alterations related to clinical and genetic features have been described. We aimed to evaluate in the brain of adult patients with DM1 (i) white and gray matter differences, including cortical-subcortical gray matter volume and cortical thickness and (ii) their correlation with clinical disability, global neuropsychological performance and triplet expansion.
Methods: We included 24 adult genetically-confirmed DM1 patients (14 males; age: 38.5 ± 11.8 years) and 25 age- and sex-matched healthy controls (14 males; age: 38.5 ± 11.3 years) who underwent an identical brain MR protocol including high-resolution 3D T1-weighted, axial T2 FLAIR and DTI sequences. All patients underwent an extensive clinical and neuropsychological evaluation. Voxel-wise analyses of white matter, performed by using Tract Based Spatial Statistics, and of gray matter, with Voxel-based Morphometry and Cortical Thickness, were carried out in order to test for differences between patients with DM1 and healthy controls (p < 0.05, corrected). The correlation between MRI measures and clinical-genetic features was also assessed.
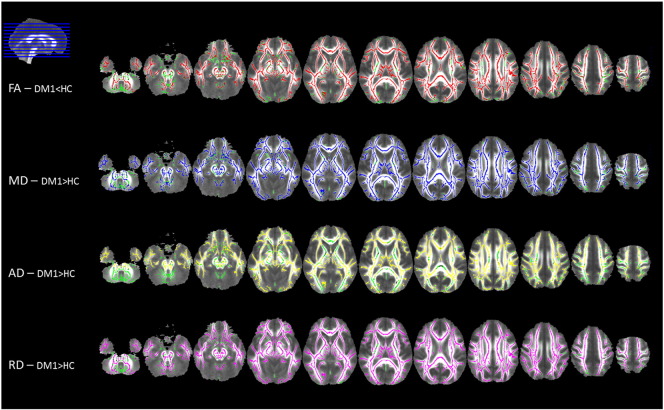
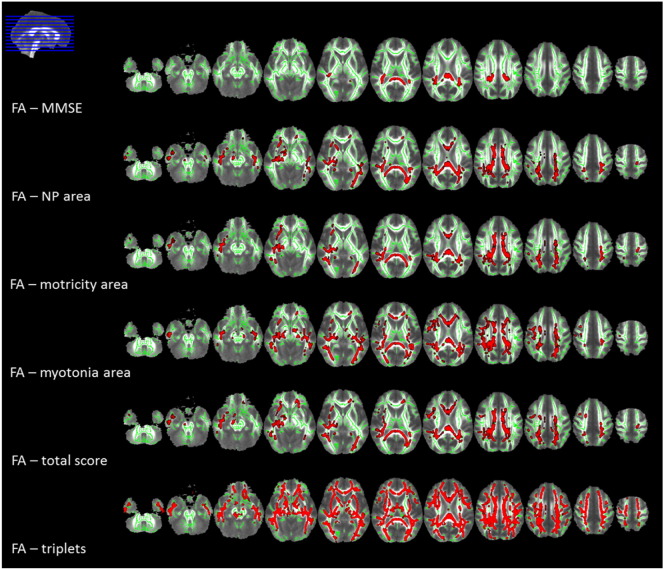
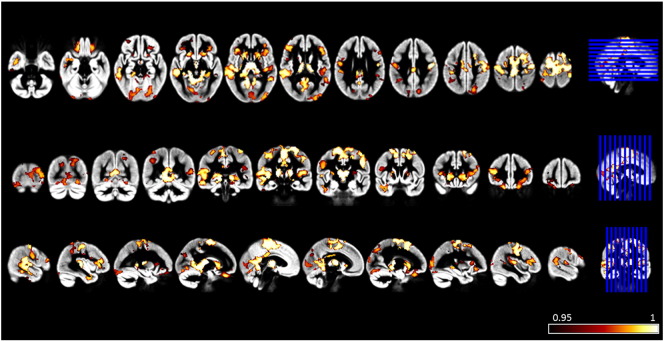
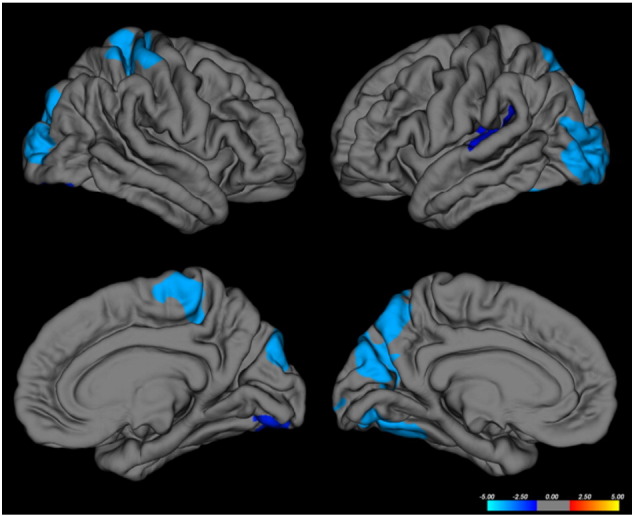
Results: Patients with DM1 showed widespread abnormalities of all DTI parameters in the white matter, which were associated with reduced gray matter volume in all brain lobes and thinning in parieto-temporo-occipital cortices, albeit with less extensive cortical alterations when congenital cases were removed from the analyses. White matter alterations correlated with clinical disability, global cognitive performance and triplet expansions.
Conclusion: In patients with DM1, the combined smaller overall gray matter volume and white matter alterations seem to be the main morpho-structural substrates of CNS involvement in this condition. The correlation of white matter differences with both clinical and genetic findings lends support to this notion.
Keywords: DTI; TBSS; VBM; cortical thickness; myotonic dystrophy type 1.
Figures
Similar articles
-
Regional brain atrophy in gray and white matter is associated with cognitive impairment in Myotonic Dystrophy type 1.Neuroimage Clin. 2019;24:102078. doi: 10.1016/j.nicl.2019.102078. Epub 2019 Nov 6. Neuroimage Clin. 2019. PMID: 31795042 Free PMC article.
-
How genetics affects the brain to produce higher-level dysfunctions in myotonic dystrophy type 1.Funct Neurol. 2015 Jan-Mar;30(1):21-31. Funct Neurol. 2015. PMID: 26214024 Free PMC article.
-
Cortical Thickness and White Matter Integrity are Associated with CTG Expansion Size in Myotonic Dystrophy Type I.Yonsei Med J. 2017 Jul;58(4):807-815. doi: 10.3349/ymj.2017.58.4.807. Yonsei Med J. 2017. PMID: 28540995 Free PMC article.
-
Human brain pathology in myotonic dystrophy type 1: A systematic review.Neuropathology. 2021 Feb;41(1):3-20. doi: 10.1111/neup.12721. Neuropathology. 2021. PMID: 33599033 Free PMC article.
-
Myotonic dystrophy: clinical and molecular parallels between myotonic dystrophy type 1 and type 2.Curr Neurol Neurosci Rep. 2002 Sep;2(5):465-70. doi: 10.1007/s11910-002-0074-6. Curr Neurol Neurosci Rep. 2002. PMID: 12169228 Review.
Cited by
-
Transcriptional signatures of synaptic vesicle genes define myotonic dystrophy type I neurodegeneration.Neuropathol Appl Neurobiol. 2021 Dec;47(7):1092-1108. doi: 10.1111/nan.12725. Epub 2021 May 17. Neuropathol Appl Neurobiol. 2021. PMID: 33955002 Free PMC article.
-
White matter integrity changes and neurocognitive functioning in adult-late onset DM1: a follow-up DTI study.Sci Rep. 2022 Mar 7;12(1):3988. doi: 10.1038/s41598-022-07820-1. Sci Rep. 2022. PMID: 35256728 Free PMC article.
-
Gray Matter Abnormalities in Myotonic Dystrophy Type 1: A Voxel-Wise Meta-Analysis.Front Neurol. 2022 Jul 7;13:891789. doi: 10.3389/fneur.2022.891789. eCollection 2022. Front Neurol. 2022. PMID: 35873771 Free PMC article.
-
Regional brain atrophy in gray and white matter is associated with cognitive impairment in Myotonic Dystrophy type 1.Neuroimage Clin. 2019;24:102078. doi: 10.1016/j.nicl.2019.102078. Epub 2019 Nov 6. Neuroimage Clin. 2019. PMID: 31795042 Free PMC article.
-
Altered power spectral density in the resting-state sensorimotor network in patients with myotonic dystrophy type 1.Sci Rep. 2018 Jan 17;8(1):987. doi: 10.1038/s41598-018-19217-0. Sci Rep. 2018. PMID: 29343751 Free PMC article.
References
-
- Andersson J.L.R., Jenkinson M., Smith S. Oxford University; Oxford, UK: 2007. Non-linear optimisation. Technical Report TR07JA1, FMRIB, Department of Clinical Neurology.http://www.fmrib.ox.ac.uk/analysis/techrep (Available at) (for downloading)
-
- Andersson J.L.R., Jenkinson M., Smith S. Technical Report TR07JA2, FMRIB. Department of Clinical Neurology, Oxford University; Oxford, UK: 2007. Non-linear registration, aka spatial normalization.http://www.fmrib.ox.ac.uk/analysis/techrep (Available at) (for downloading)
-
- Behrens T.E.J., Woolrich M.W., Jenkinson M. Characterization and propagation of uncertainty in diffusion-weighted MR imaging. Magn. Reson. Med. 2003;50(5):1077–1088. - PubMed
MeSH terms
Substances
LinkOut - more resources
Full Text Sources
Other Literature Sources
