

Metabolomics Analysis Reveals the Participation of Efflux Pumps and Ornithine in the Response of Pseudomonas putida DOT-T1E Cells to Challenge with Propranolol
- PMID: 27331395
- PMCID: PMC4917112
- DOI: 10.1371/journal.pone.0156509
Metabolomics Analysis Reveals the Participation of Efflux Pumps and Ornithine in the Response of Pseudomonas putida DOT-T1E Cells to Challenge with Propranolol
Abstract
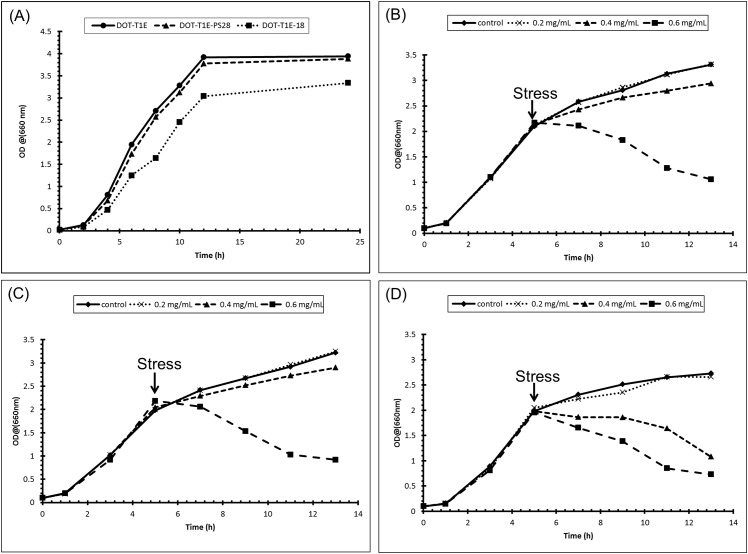
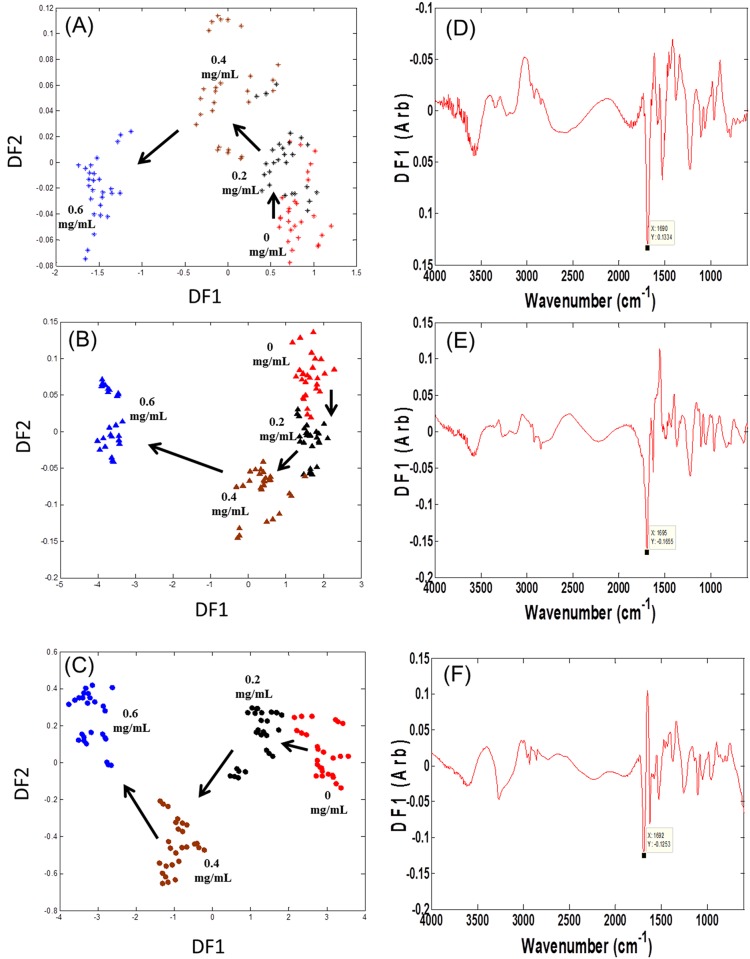
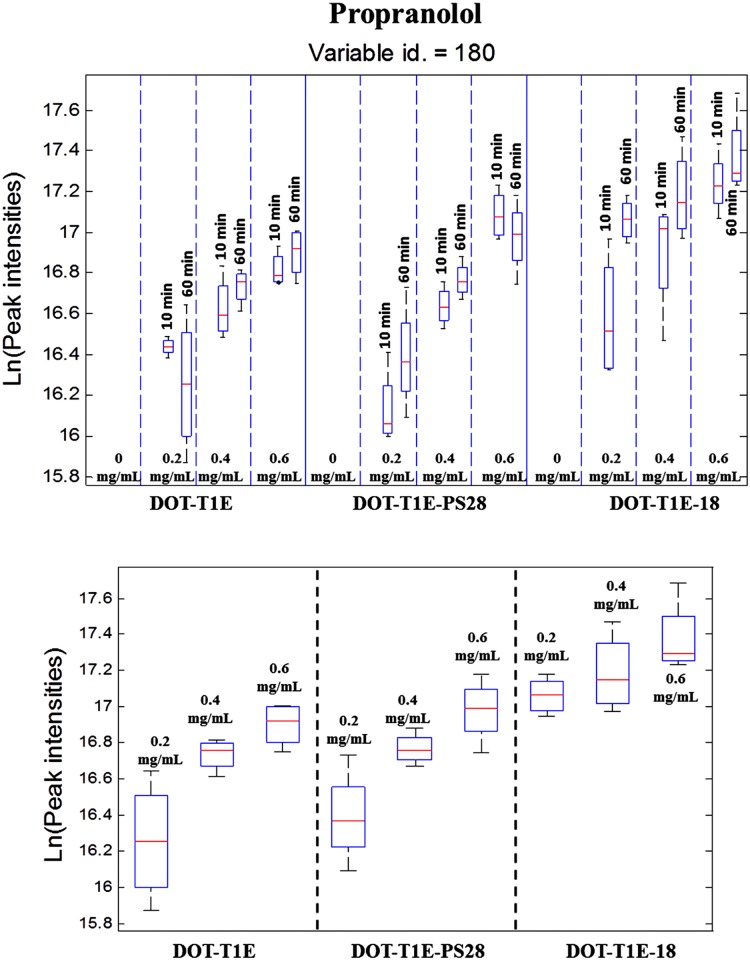
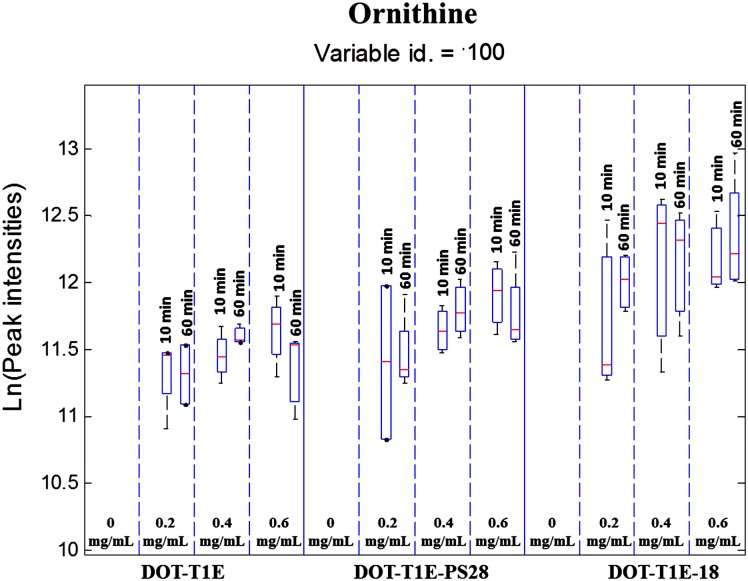
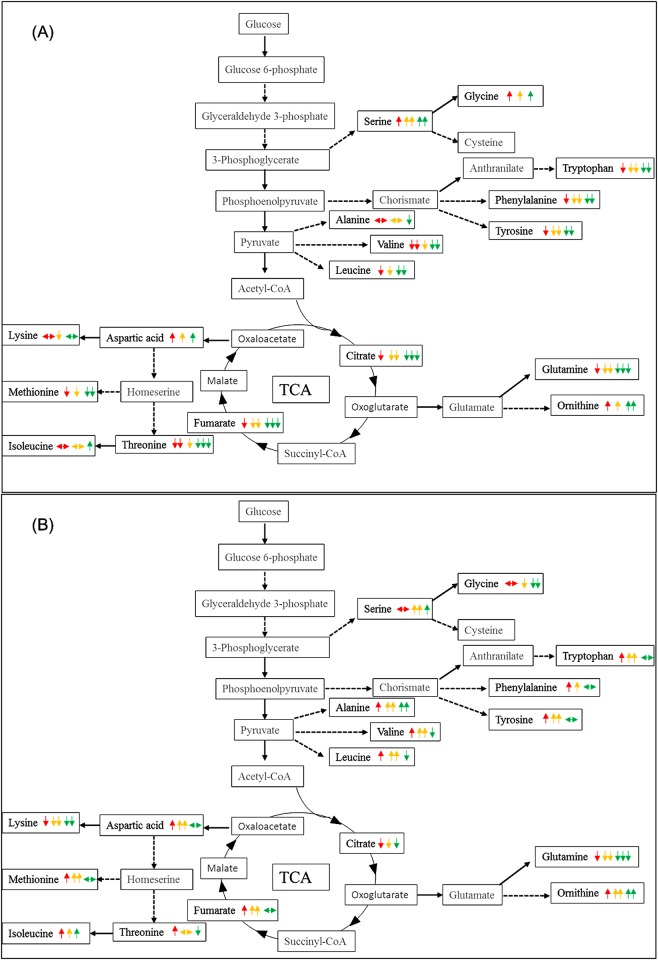
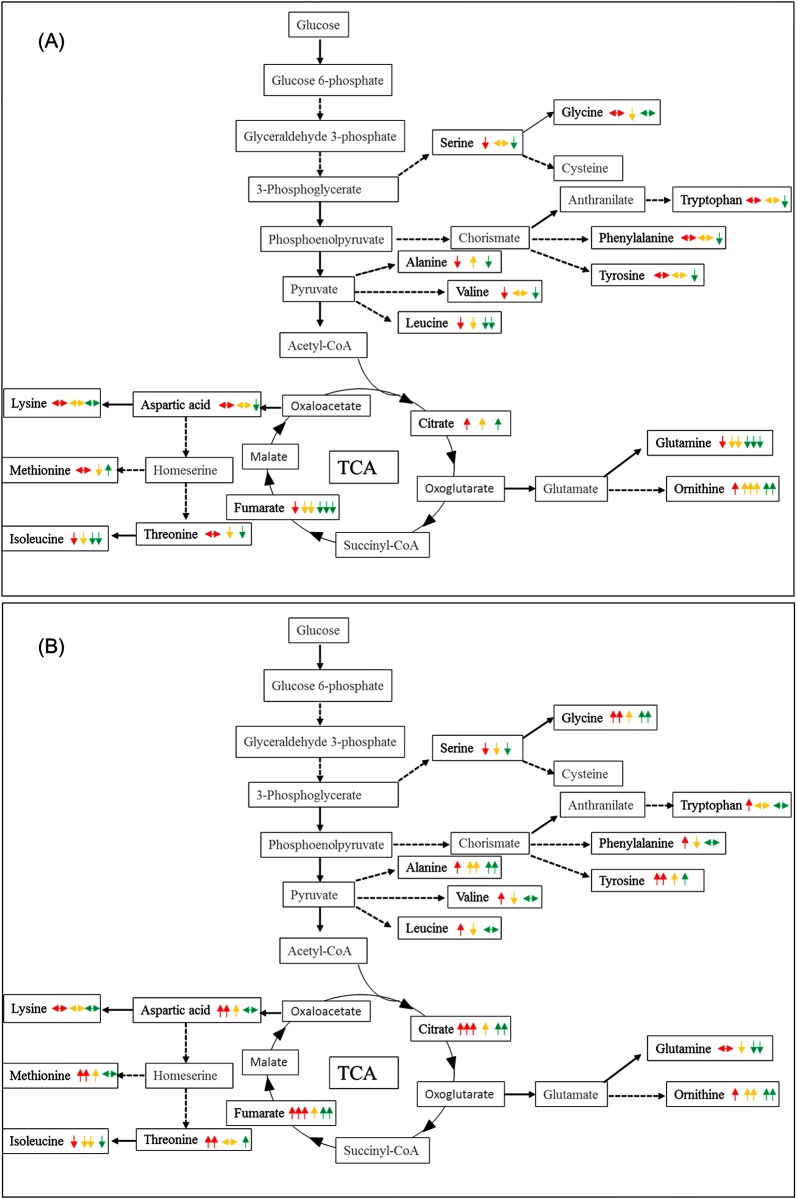
Efflux pumps are critically important membrane components that play a crucial role in strain tolerance in Pseudomonas putida to antibiotics and aromatic hydrocarbons that result in these toxicants being expelled from the bacteria. Here, the effect of propranolol on P. putida was examined by sudden addition of 0.2, 0.4 and 0.6 mg mL-1 of this β-blocker to several strains of P. putida, including the wild type DOT-T1E and the efflux pump knockout mutants DOT-T1E-PS28 and DOT-T1E-18. Bacterial viability measurements reveal that the efflux pump TtgABC plays a more important role than the TtgGHI pump in strain tolerance to propranolol. Mid-infrared (MIR) spectroscopy was then used as a rapid, high-throughput screening tool to investigate any phenotypic changes resulting from exposure to varying levels of propranolol. Multivariate statistical analysis of these MIR data revealed gradient trends in resultant ordination scores plots, which were related to the concentration of propranolol. MIR illustrated phenotypic changes associated with the presence of this drug within the cell that could be assigned to significant changes that occurred within the bacterial protein components. To complement this phenotypic fingerprinting approach metabolic profiling was performed using gas chromatography mass spectrometry (GC-MS) to identify metabolites of interest during the growth of bacteria following toxic perturbation with the same concentration levels of propranolol. Metabolic profiling revealed that ornithine, which was only produced by P. putida cells in the presence of propranolol, presents itself as a major metabolic feature that has important functions in propranolol stress tolerance mechanisms within this highly significant and environmentally relevant species of bacteria.
Conflict of interest statement
Figures
Similar articles
-
Metabolic analysis of the response of Pseudomonas putida DOT-T1E strains to toluene using Fourier transform infrared spectroscopy and gas chromatography mass spectrometry.Metabolomics. 2016;12:112. doi: 10.1007/s11306-016-1054-1. Epub 2016 Jun 21. Metabolomics. 2016. PMID: 27398079 Free PMC article.
-
Metabolomics reveals the physiological response of Pseudomonas putida KT2440 (UWC1) after pharmaceutical exposure.Mol Biosyst. 2016 Apr;12(4):1367-77. doi: 10.1039/c5mb00889a. Epub 2016 Mar 2. Mol Biosyst. 2016. PMID: 26932201
-
Efflux pumps involved in toluene tolerance in Pseudomonas putida DOT-T1E.J Bacteriol. 1998 Jul;180(13):3323-9. doi: 10.1128/JB.180.13.3323-3329.1998. J Bacteriol. 1998. PMID: 9642183 Free PMC article.
-
Mechanisms of solvent tolerance in gram-negative bacteria.Annu Rev Microbiol. 2002;56:743-68. doi: 10.1146/annurev.micro.56.012302.161038. Epub 2002 Jan 30. Annu Rev Microbiol. 2002. PMID: 12142492 Review.
-
Analysis of solvent tolerance in Pseudomonas putida DOT-T1E based on its genome sequence and a collection of mutants.FEBS Lett. 2012 Aug 31;586(18):2932-8. doi: 10.1016/j.febslet.2012.07.031. Epub 2012 Jul 20. FEBS Lett. 2012. PMID: 22819823 Review.
Cited by
-
Propranolol restores susceptibility of XDR Gram-negative pathogens to meropenem and Meropenem combination has been evaluated with either tigecycline or amikacin.BMC Microbiol. 2023 Jul 22;23(1):195. doi: 10.1186/s12866-023-02934-6. BMC Microbiol. 2023. PMID: 37481513 Free PMC article.
-
Metabolomics Reveal Potential Natural Substrates of AcrB in Escherichia coli and Salmonella enterica Serovar Typhimurium.mBio. 2021 Mar 30;12(2):e00109-21. doi: 10.1128/mBio.00109-21. mBio. 2021. PMID: 33785633 Free PMC article.
-
Propranolol, chlorpromazine and diclofenac restore susceptibility of extensively drug-resistant (XDR)-Acinetobacter baumannii to fluoroquinolones.PLoS One. 2020 Aug 26;15(8):e0238195. doi: 10.1371/journal.pone.0238195. eCollection 2020. PLoS One. 2020. PMID: 32845920 Free PMC article.
-
Assessment of New and Genome-Reduced Pseudomonas Strains Regarding Their Robustness as Chassis in Biotechnological Applications.Microorganisms. 2023 Mar 25;11(4):837. doi: 10.3390/microorganisms11040837. Microorganisms. 2023. PMID: 37110260 Free PMC article.
-
Partial Least Squares with Structured Output for Modelling the Metabolomics Data Obtained from Complex Experimental Designs: A Study into the Y-Block Coding.Metabolites. 2016 Oct 28;6(4):38. doi: 10.3390/metabo6040038. Metabolites. 2016. PMID: 27801817 Free PMC article.
References
-
- Breton R, Boxall A. Pharmaceuticals and personal care products in the environment: Regulatory drivers and research needs. Qsar & Combinatorial Science. 2003;22(3):399–409. 10.1002/qsar.200390030 - DOI
MeSH terms
Substances
Grants and funding
LinkOut - more resources
Full Text Sources
Other Literature Sources
Molecular Biology Databases
Miscellaneous
