

Hypoxia-mediated upregulation of MCT1 expression supports the glycolytic phenotype of glioblastomas
- PMID: 27331625
- PMCID: PMC5216802
- DOI: 10.18632/oncotarget.10114
Hypoxia-mediated upregulation of MCT1 expression supports the glycolytic phenotype of glioblastomas
Abstract
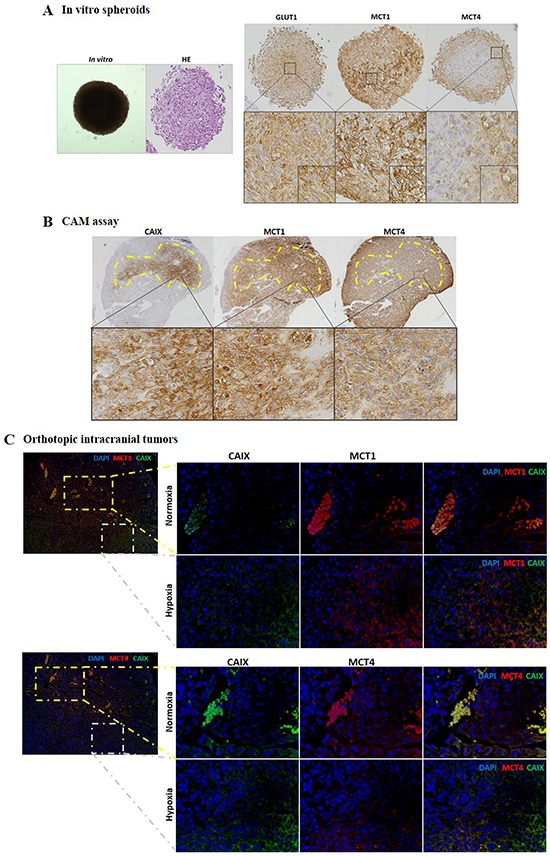
Background: Glioblastomas (GBM) present a high cellular heterogeneity with conspicuous necrotic regions associated with hypoxia, which is related to tumor aggressiveness. GBM tumors exhibit high glycolytic metabolism with increased lactate production that is extruded to the tumor microenvironment through monocarboxylate transporters (MCTs). While hypoxia-mediated regulation of MCT4 has been characterized, the role of MCT1 is still controversial. Thus, we aimed to understand the role of hypoxia in the regulation of MCT expression and function in GBM, MCT1 in particular.
Methods: Expression of hypoxia- and glycolytic-related markers, as well as MCT1 and MCT4 isoforms was assessed in in vitro and in vivo orthotopic glioma models, and also in human GBM tissues by immunofluorescence/immunohistochemistry and Western blot. Following MCT1 inhibition, either pharmacologically with CHC (α-cyano-4-hydroxynnamic acid) or genetically with siRNAs, we assessed GBM cell viability, proliferation, metabolism, migration and invasion, under normoxia and hypoxia conditions.
Results: Hypoxia induced an increase in MCT1 plasma membrane expression in glioma cells, both in in vitro and in vivo models. Additionally, treatment with CHC and downregulation of MCT1 in glioma cells decreased lactate production, cell proliferation and invasion under hypoxia. Moreover, in the in vivo orthotopic model and in human GBM tissues, there was extensive co-expression of MCT1, but not MCT4, with the GBM hypoxia marker CAIX.
Conclusion: Hypoxia-induced MCT1 supports GBM glycolytic phenotype, being responsible for lactate efflux and an important mediator of cell survival and aggressiveness. Therefore, MCT1 constitutes a promising therapeutic target in GBM.
Keywords: Warburg effect; glioblastomas; lactate; monocarboxylate transporters (MCTs); tumor hypoxia.
Conflict of interest statement
The authors declare no conflicts of interest.
Figures


Similar articles
-
Monocarboxylate transporters (MCTs) in gliomas: expression and exploitation as therapeutic targets.Neuro Oncol. 2013 Feb;15(2):172-88. doi: 10.1093/neuonc/nos298. Epub 2012 Dec 20. Neuro Oncol. 2013. PMID: 23258846 Free PMC article.
-
The Monocarboxylate Transporters MCT1 and MCT4 Are Highly Expressed in Glioblastoma and Crucially Implicated in the Pathobiology.Neuropathology. 2025 Aug;45(4):e70006. doi: 10.1111/neup.70006. Epub 2025 Mar 27. Neuropathology. 2025. PMID: 40145253
-
Targeting lactate transport suppresses in vivo breast tumour growth.Oncotarget. 2015 Aug 7;6(22):19177-89. doi: 10.18632/oncotarget.3910. Oncotarget. 2015. PMID: 26203664 Free PMC article.
-
The expression of lactate transporters (MCT1 and MCT4) in heart and muscle.Eur J Appl Physiol. 2001 Nov;86(1):6-11. doi: 10.1007/s004210100516. Eur J Appl Physiol. 2001. PMID: 11820324 Review.
-
Lactate Transporters and pH Regulation: Potential Therapeutic Targets in Glioblastomas.Curr Cancer Drug Targets. 2016;16(5):388-99. doi: 10.2174/1568009616666151222150543. Curr Cancer Drug Targets. 2016. PMID: 26694251 Review.
Cited by
-
Ion Transport and Radioresistance.Rev Physiol Biochem Pharmacol. 2022;183:217-249. doi: 10.1007/112_2020_33. Rev Physiol Biochem Pharmacol. 2022. PMID: 32737751 Review.
-
Metabolic Profiles Point Out Metabolic Pathways Pivotal in Two Glioblastoma (GBM) Cell Lines, U251 and U-87MG.Biomedicines. 2023 Jul 20;11(7):2041. doi: 10.3390/biomedicines11072041. Biomedicines. 2023. PMID: 37509679 Free PMC article.
-
Metabolic alterations underlying Bevacizumab therapy in glioblastoma cells.Oncotarget. 2017 Oct 10;8(61):103657-103670. doi: 10.18632/oncotarget.21761. eCollection 2017 Nov 28. Oncotarget. 2017. PMID: 29262591 Free PMC article.
-
Immune response recalibration using immune therapy and biomimetic nano-therapy against high-grade gliomas and brain metastases.Asian J Pharm Sci. 2025 Apr;20(2):101021. doi: 10.1016/j.ajps.2025.101021. Epub 2025 Jan 17. Asian J Pharm Sci. 2025. PMID: 40224727 Free PMC article. Review.
-
[Regulation of tumor cell glycometabolism and tumor therapy].Sheng Wu Yi Xue Gong Cheng Xue Za Zhi. 2019 Aug 25;36(4):691-695. doi: 10.7507/1001-5515.201812025. Sheng Wu Yi Xue Gong Cheng Xue Za Zhi. 2019. PMID: 31441273 Free PMC article. Review. Chinese.
References
-
- Hanahan D, Weinberg RA. Hallmarks of cancer: the next generation. Cell. 2011;144:646–674. - PubMed
-
- Cairns RA, Harris IS, Mak TW. Regulation of cancer cell metabolism. Nature reviews Cancer. 2011;11:85–95. - PubMed
-
- Warburg O. On respiratory impairment in cancer cells. Science. 1956;124:269–270. - PubMed
-
- Gatenby RA, Gillies RJ. Why do cancers have high aerobic glycolysis? Nature reviews Cancer. 2004;4:891–899. - PubMed
-
- Denko NC. Hypoxia, HIF1 and glucose metabolism in the solid tumour. Nature reviews Cancer. 2008;8:705–713. - PubMed
MeSH terms
Substances
LinkOut - more resources
Full Text Sources
Other Literature Sources
Medical
Molecular Biology Databases
