. 2016 Jun 22;11(6):e0157989.
doi: 10.1371/journal.pone.0157989. eCollection 2016.

A Survey of Bioinformatics Database and Software Usage through Mining the Literature

Affiliations

A Survey of Bioinformatics Database and Software Usage through Mining the Literature

Geraint Duck et al. PLoS One. .

Abstract

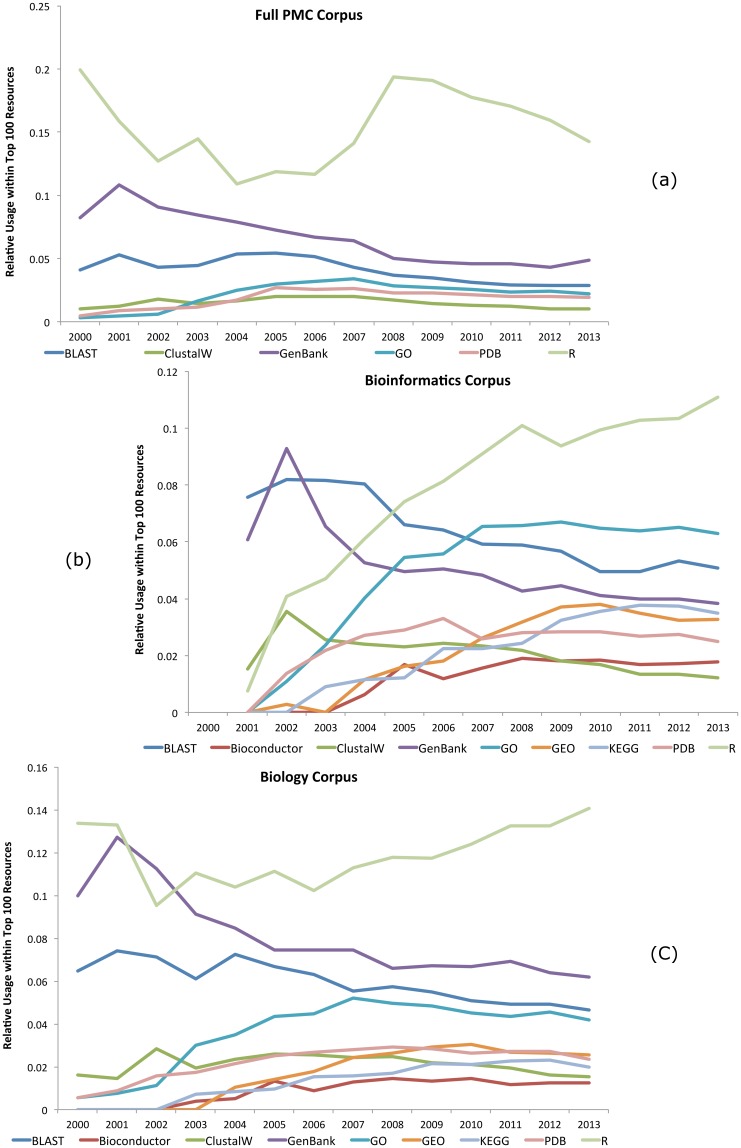
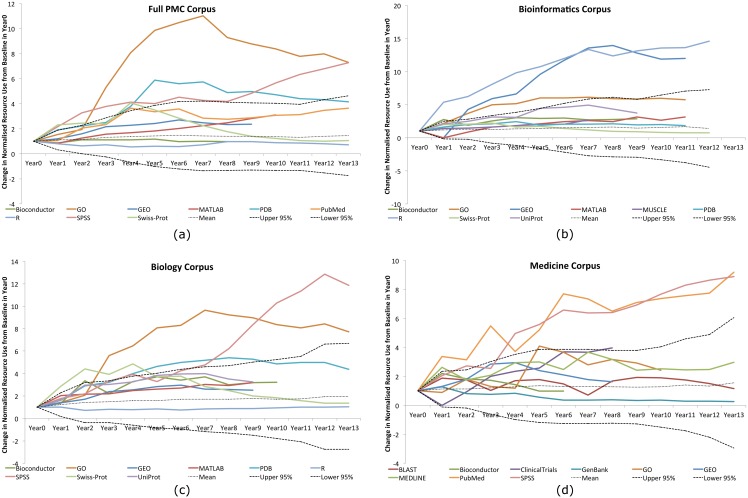
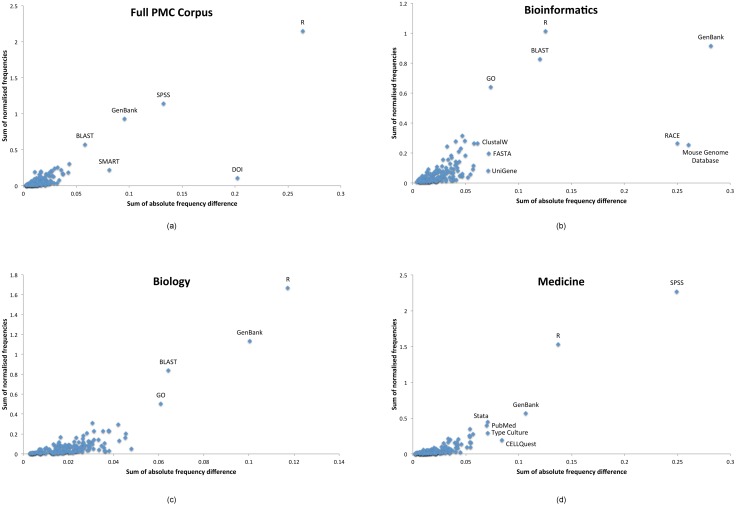
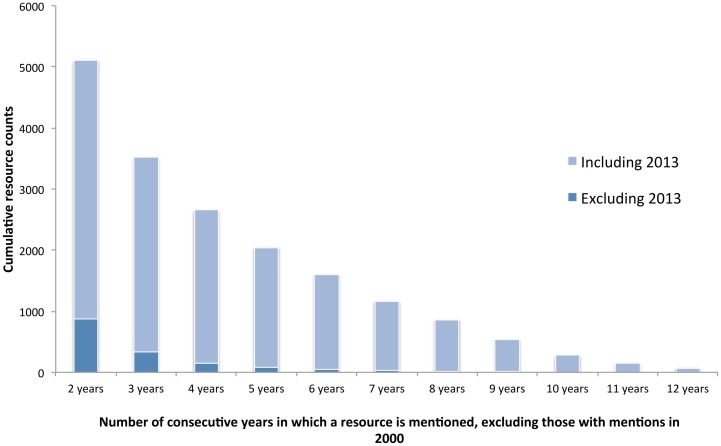
Computer-based resources are central to much, if not most, biological and medical research. However, while there is an ever expanding choice of bioinformatics resources to use, described within the biomedical literature, little work to date has provided an evaluation of the full range of availability or levels of usage of database and software resources. Here we use text mining to process the PubMed Central full-text corpus, identifying mentions of databases or software within the scientific literature. We provide an audit of the resources contained within the biomedical literature, and a comparison of their relative usage, both over time and between the sub-disciplines of bioinformatics, biology and medicine. We find that trends in resource usage differs between these domains. The bioinformatics literature emphasises novel resource development, while database and software usage within biology and medicine is more stable and conservative. Many resources are only mentioned in the bioinformatics literature, with a relatively small number making it out into general biology, and fewer still into the medical literature. In addition, many resources are seeing a steady decline in their usage (e.g., BLAST, SWISS-PROT), though some are instead seeing rapid growth (e.g., the GO, R). We find a striking imbalance in resource usage with the top 5% of resource names (133 names) accounting for 47% of total usage, and over 70% of resources extracted being only mentioned once each. While these results highlight the dynamic and creative nature of bioinformatics research they raise questions about software reuse, choice and the sharing of bioinformatics practice. Is it acceptable that so many resources are apparently never reused? Finally, our work is a step towards automated extraction of scientific method from text. We make the dataset generated by our study available under the CC0 license here: http://dx.doi.org/10.6084/m9.figshare.1281371.


Conflict of interest statement

Competing Interests: The authors have declared that no competing interests exist.

Figures

Fig 1
Fig 1. Model selection results across five different machine-learning classifiers, using 10x10-fold cross-validation.
The box indicates the upper/lower quartiles, the horizontal line inside each of them shows the median value, while the dotted crossbars indicate the maximum/minimum values. Both the Fβ = 1 measure (a) and ROC Area Under the Curve (b) comparisons indicate that Random Forest provides the best performance.
Fig 2
Fig 2. Average number of resource mentions per article in each document corpus evaluated over time.
Fig 3
Fig 3. Average number of document level resource mentions per article in each document corpus evaluated over time.
Fig 4
Fig 4. The percentage of articles within each document corpus to contain at least one extracted resource mention, as evaluated over time.
Fig 5
Fig 5. The relative usage of several key resources within the top 100 mentioned resources (document level), for each of our corpora, as calculated over time.
No graph is provided for our medicine corpus as the relative usage numbers within that corpus were low.
Fig 6
Fig 6. The upper and lower 95% confidence bounds in normalised relative change for several key resources in each of our corpora.
Fig 7
Fig 7. Relative usage variation within the top 100 resources for each of our corpora.
We plot the sum of the normalised frequencies (y-axis; relative resource usage), against the sum of the absolute differences (x-axis; usage variation), with interesting outliers labelled. Data based on resource mentions extracted in the period 2000–2013 inclusive. We filtered out mentions only seen in a single year.
Fig 8
Fig 8. Cumulative number of resources that have persisted for a given number of years.
The dark blue contains only resources that have not been mentioned in 2013, whereas the light blue contains resource mentioned in 2013. We excluded previously established resources by filtering out resources mentioned in 2000 (year zero).
Fig 9
Fig 9. Comparison of journals based on the percentage of articles to contain a resource mention.
Fig 10
Fig 10. Plot of the two most important eigenvectors for journals, based on the resources contained within them.
The x-axis appears to separate medical journals from bioinformatics based journals. The y-axis separates out two outliers—PLoS ONE (which is a extreme multi-disciplinary journal), and Acta Crystallography (which contained unusually frequent false positive mentions of R and SMART).
Fig 11
Fig 11. Plot of the two most important eigenvectors for resources, based on the journals they are mentioned within.
The x-axis appears to separate bioinformatics resources from statistical software, whereas the y-axis appears to separate out SMART and R with some mass-spectroscopy tools (perhaps because these were pervasive false positives within Acta Crystallography).

References

    1. Cannata N, Merelli E, Altman RB. Time to organize the bioinformatics resourceome. PLoS Computational Biology. 2005. December;1(7):e76 10.1371/journal.pcbi.0010076 - DOI - PMC - PubMed
    1. Wren JD, Bateman A. Databases, data tombs and dust in the wind. Bioinformatics. 2008. October;24(19):2127–8. 10.1093/bioinformatics/btn464 - DOI - PubMed
    1. Gilbert D. Software review: Bioinformatics software resources. Briefings in Bioinformatics. 2004;5(3):300–304. - PubMed
    1. Babu PA, Udyama J, Kumar RK, Boddepalli R, Mangala DS, Rao GN. DoD2007: 1082 molecular biology databases. Bioinformation. 2007. January;2(2):64–7. Available from: http://www.ncbi.nlm.nih.gov/pmc/articles/PMC2174421/. 10.6026/97320630002064 - DOI - PMC - PubMed
    1. Discala C, Benigni X, Barillot E, Vaysseix G. DBcat: a catalog of 500 biological databases. Nucleic Acids Research. 2000. January;28(1):8–9. 10.1093/nar/28.1.8 - DOI - PMC - PubMed