

Stretch-Activated Current Can Promote or Suppress Cardiac Alternans Depending on Voltage-Calcium Interaction
- PMID: 27332125
- PMCID: PMC4919541
- DOI: 10.1016/j.bpj.2016.05.026
Stretch-Activated Current Can Promote or Suppress Cardiac Alternans Depending on Voltage-Calcium Interaction
Abstract
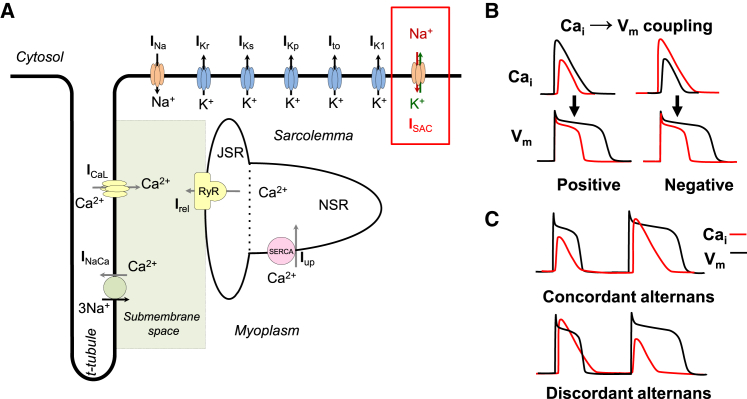
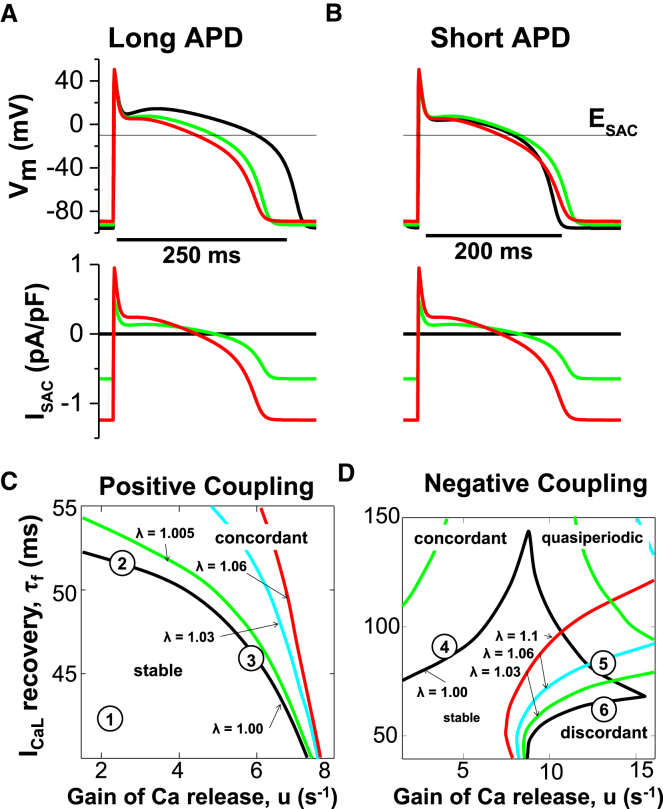
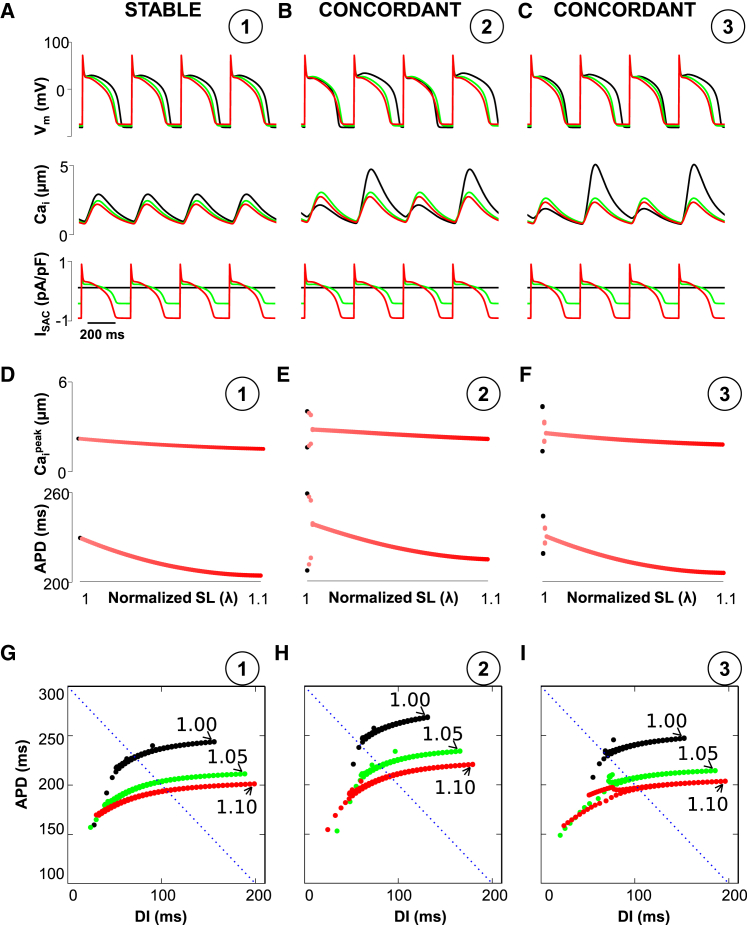
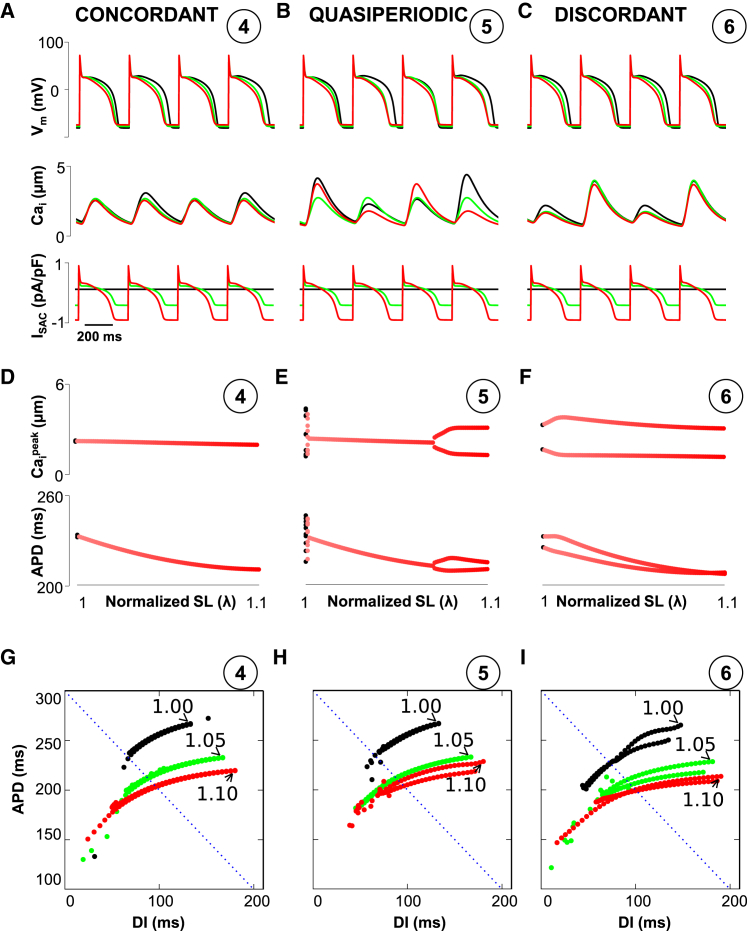
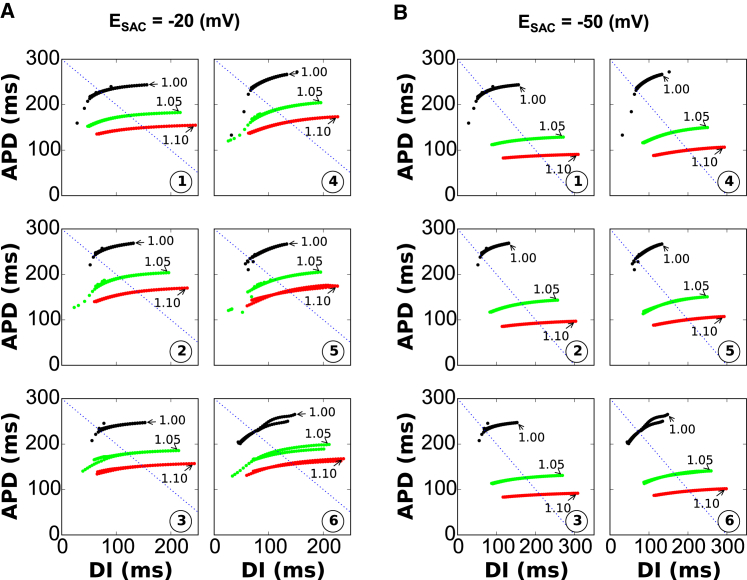
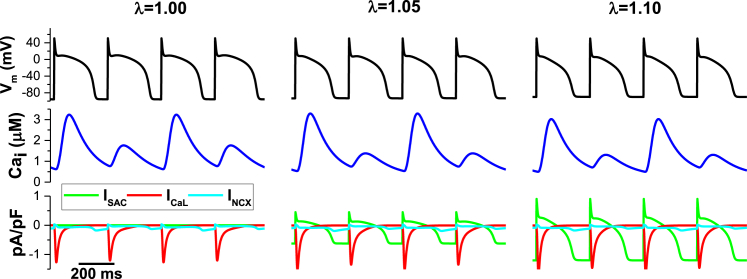
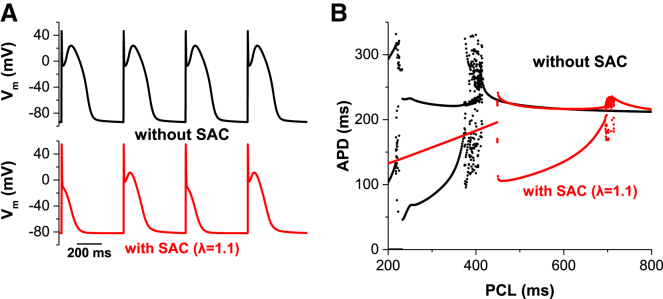
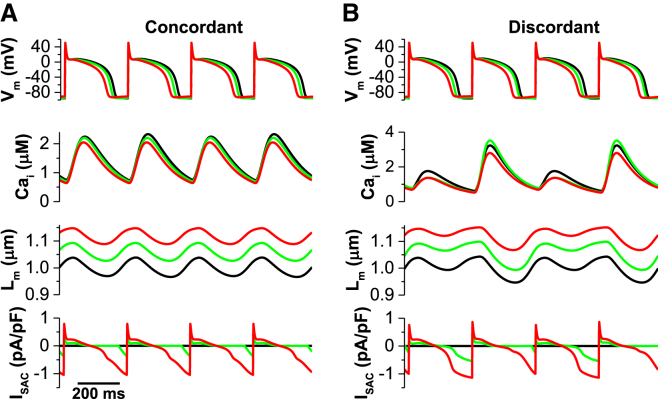
Cardiac alternans has been linked to the onset of ventricular fibrillation and ventricular tachycardia, leading to life-threatening arrhythmias. Here, we investigated the effects of stretch-activated currents (ISAC) on alternans using a physiologically detailed model of the ventricular myocyte. We found that increasing ISAC suppresses alternans if the voltage-Ca coupling is positive or the alternans is voltage driven. However, for electromechanically discordant alternans, which occurs when the alternans is Ca driven with negative voltage-Ca coupling, increasing ISAC promotes Ca alternans. In addition, if action potential duration-Ca transients show quasiperiodicity, we observe a biphasic effect of ISAC, i.e., suppressing quasiperiodic oscillation at small stretch but promoting electromechanically discordant alternans at larger stretch. Our results demonstrate how ISAC interacts with coupled voltage-Ca dynamical systems with respect to alternans.
Copyright © 2016 Biophysical Society. Published by Elsevier Inc. All rights reserved.
Figures
Similar articles
-
Dynamical effects of calcium-sensitive potassium currents on voltage and calcium alternans.J Physiol. 2017 Apr 1;595(7):2285-2297. doi: 10.1113/JP273626. Epub 2017 Jan 24. J Physiol. 2017. PMID: 27902841 Free PMC article.
-
Cardiac alternans induced by fibroblast-myocyte coupling: mechanistic insights from computational models.Am J Physiol Heart Circ Physiol. 2009 Aug;297(2):H775-84. doi: 10.1152/ajpheart.00341.2009. Epub 2009 May 29. Am J Physiol Heart Circ Physiol. 2009. PMID: 19482965 Free PMC article.
-
Coupled dynamics of voltage and calcium in paced cardiac cells.Phys Rev E Stat Nonlin Soft Matter Phys. 2005 Feb;71(2 Pt 1):021903. doi: 10.1103/PhysRevE.71.021903. Epub 2005 Feb 8. Phys Rev E Stat Nonlin Soft Matter Phys. 2005. PMID: 15783348 Free PMC article.
-
Cardiac alternans and intracellular calcium cycling.Clin Exp Pharmacol Physiol. 2014 Jul;41(7):524-32. doi: 10.1111/1440-1681.12231. Clin Exp Pharmacol Physiol. 2014. PMID: 25040398 Free PMC article. Review.
-
From pulsus to pulseless: the saga of cardiac alternans.Circ Res. 2006 May 26;98(10):1244-53. doi: 10.1161/01.RES.0000224540.97431.f0. Circ Res. 2006. PMID: 16728670 Review.
Cited by
-
Competing Mechanisms of Stress-Assisted Diffusivity and Stretch-Activated Currents in Cardiac Electromechanics.Front Physiol. 2018 Dec 3;9:1714. doi: 10.3389/fphys.2018.01714. eCollection 2018. Front Physiol. 2018. PMID: 30559677 Free PMC article.
-
Mechanoelectric coupling and arrhythmogenesis in cardiomyocytes contracting under mechanical afterload in a 3D viscoelastic hydrogel.Proc Natl Acad Sci U S A. 2021 Aug 3;118(31):e2108484118. doi: 10.1073/pnas.2108484118. Proc Natl Acad Sci U S A. 2021. PMID: 34326268 Free PMC article.
-
Cardiac dynamics: Alternans and arrhythmogenesis.J Arrhythm. 2016 Oct;32(5):411-417. doi: 10.1016/j.joa.2016.02.009. Epub 2016 Mar 28. J Arrhythm. 2016. PMID: 27761166 Free PMC article. Review.
-
Modeling autoregulation of cardiac excitation-Ca-contraction and arrhythmogenic activities in response to mechanical load changes.iScience. 2025 Jan 10;28(2):111788. doi: 10.1016/j.isci.2025.111788. eCollection 2025 Feb 21. iScience. 2025. PMID: 39935456 Free PMC article.
-
Dynamical effects of mechano-chemo-transduction on cardiac alternans.Biophys J. 2025 Feb 18;124(4):693-703. doi: 10.1016/j.bpj.2025.01.006. Epub 2025 Jan 16. Biophys J. 2025. PMID: 39825564
References
-
- Bers D.M. Cardiac excitation-contraction coupling. Nature. 2002;415:198–205. - PubMed
-
- Niu W., Sachs F. Dynamic properties of stretch-activated K+ channels in adult rat atrial myocytes. Prog. Biophys. Mol. Biol. 2003;82:121–135. - PubMed
-
- Zeng T., Bett G.C., Sachs F. Stretch-activated whole cell currents in adult rat cardiac myocytes. Am. J. Physiol. Heart Circ. Physiol. 2000;278:H548–H557. - PubMed
-
- Riemer T.L., Sobie E.A., Tung L. Stretch-induced changes in arrhythmogenesis and excitability in experimentally based heart cell models. Am. J. Physiol. 1998;275:H431–H442. - PubMed
MeSH terms
Substances
Grants and funding
LinkOut - more resources
Full Text Sources
Other Literature Sources
Medical
