. 2016 Jun 21;110(12):2779-2789.
doi: 10.1016/j.bpj.2016.03.023.

Micromechanical Analysis of the Hyaluronan-Rich Matrix Surrounding the Oocyte Reveals a Uniquely Soft and Elastic Composition

Affiliations

Micromechanical Analysis of the Hyaluronan-Rich Matrix Surrounding the Oocyte Reveals a Uniquely Soft and Elastic Composition

Xinyue Chen et al. Biophys J. .

Abstract

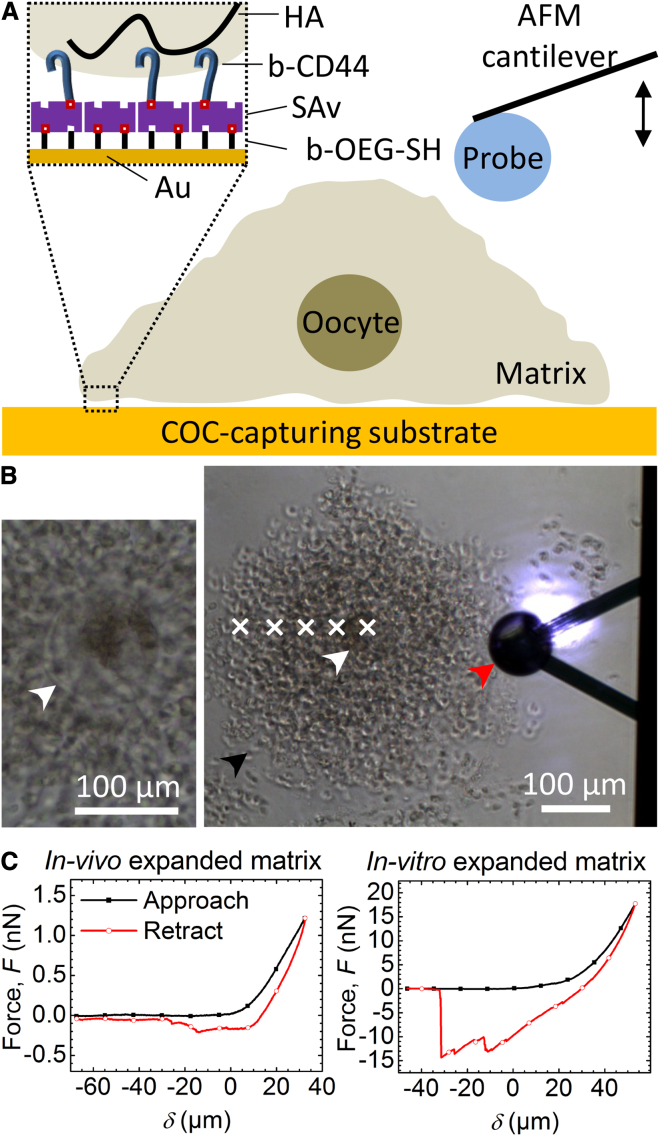
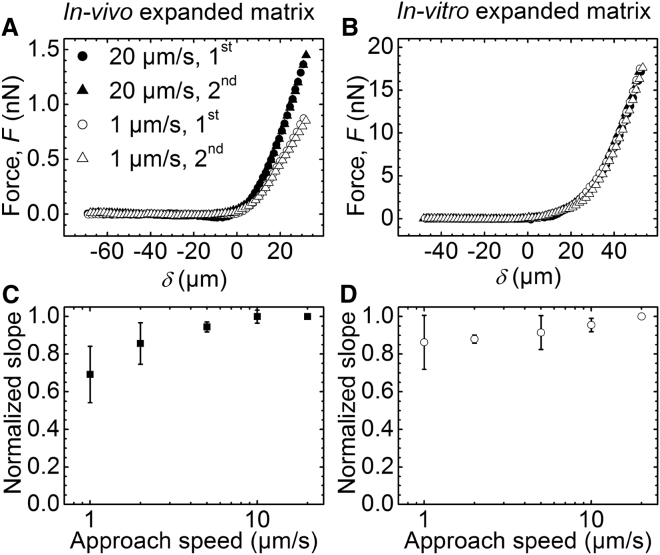
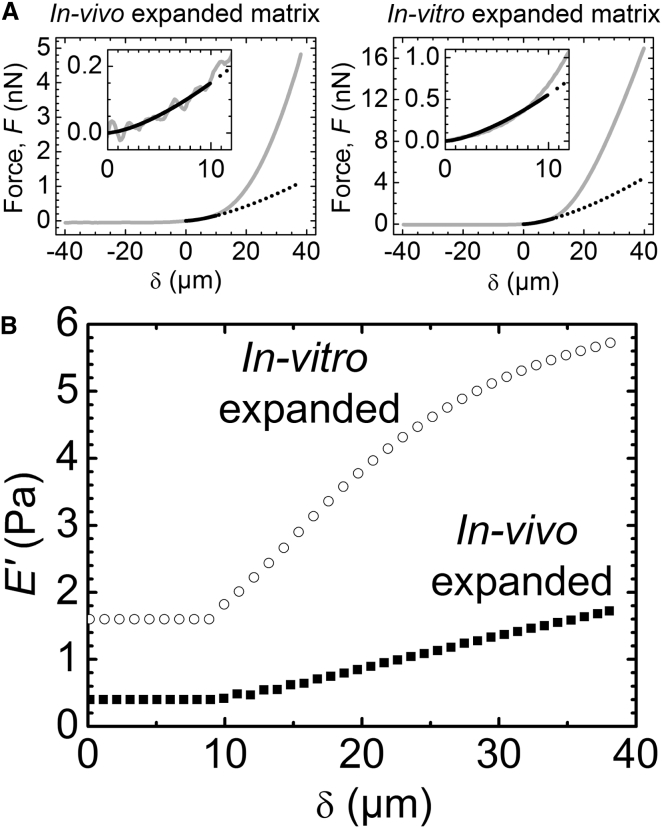
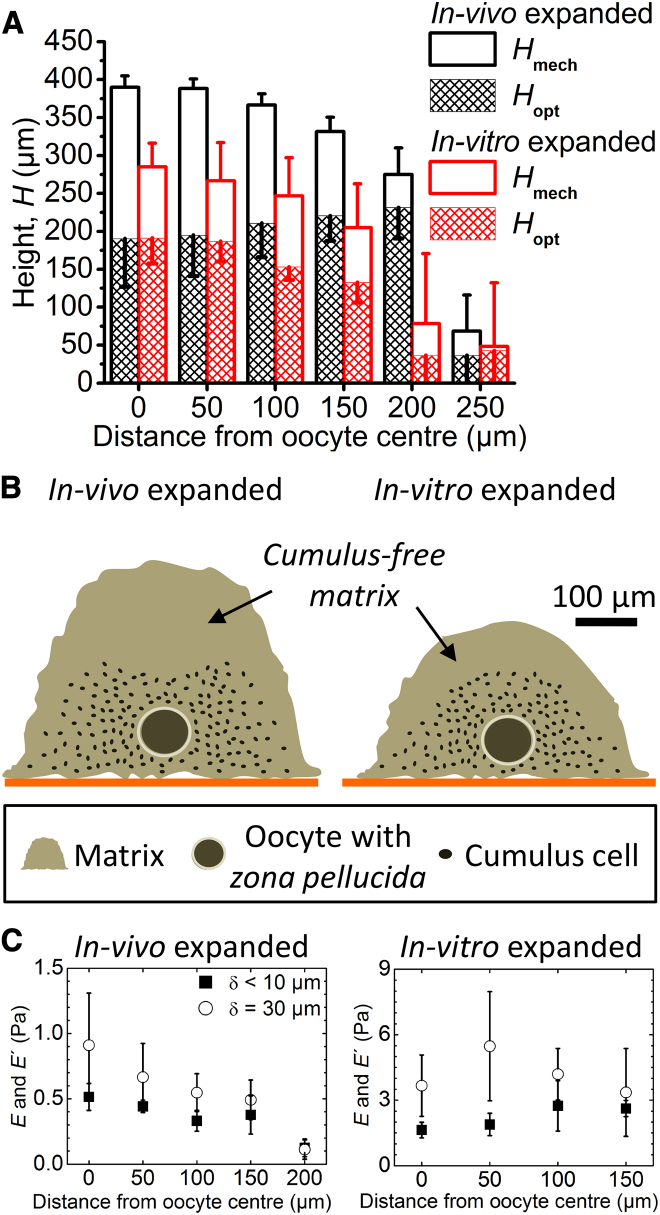
The cumulus cell-oocyte complex (COC) matrix is an extended coat that forms around the oocyte a few hours before ovulation and plays vital roles in oocyte biology. Here, we analyzed the micromechanical response of mouse COC matrix by colloidal-probe atomic force microscopy. We found that the COC matrix is elastic insofar as it does not flow and its original shape is restored after force release. At the same time, the COC matrix is extremely soft. Specifically, the most compliant parts of in vivo and in vitro expanded COC matrices yielded Young's modulus values of 0.5 ± 0.1 Pa and 1.6 ± 0.3 Pa, respectively, suggesting both high porosity and a large mesh size (≥100 nm). In addition, the elastic modulus increased progressively with indentation. Furthermore, using optical microscopy to correlate these mechanical properties with ultrastructure, we discovered that the COC is surrounded by a thick matrix shell that is essentially devoid of cumulus cells and is enhanced upon COC expansion in vivo. We propose that the pronounced nonlinear elastic behavior of the COC matrix is a consequence of structural heterogeneity and serves important functions in biological processes such as oocyte transport in the oviduct and sperm penetration.


Figures

Figure 1
Figure 1
(A) Scheme of the AFM force-indentation measurement setup. The inset illustrates the assembly of the COC-capturing surface. (B) Representative optical micrograph of the measurement setup (right). The red arrowhead marks the colloidal probe attached to the V-shaped AFM cantilever and the chip (right: the shiny spot on the upper cantilever arm is the laser detecting cantilever deflection). Cumulus cells in the COC matrix (one is marked with a black arrowhead) and the oocyte (white arrowhead) are also visible. Force curves were acquired at locations labeled with white crosses, starting above the oocyte center and interspaced by 50 μm. The left micrograph provides a magnified view of an oocyte, where the zona pellucida surrounding the oocyte (marked by a white arrowhead) can be identified. (C) Representative curves of force versus distance from contact point δ, acquired upon approach to (black line with solid square symbols) and retraction from (red line with open circle symbols) in vivo (left) and in vitro (right) expanded COC matrices; δ was set to 0 at the contact point at approach, and positive distances correspond to sample indentation.
Figure 2
Figure 2
Effects of compressive forces on indentation of the COC matrix: elastic versus plastic and viscous deformation. (A and B) Representative curves of force versus distance from contact point δ, measured on COCs expanded in vivo (A) and in vitro (B). The first and second approach curves obtained at a previously unperturbed position on the COC are shown for two selected approach speeds (1 μm/s and 20 μm/s, as indicated). (C and D) Slopes measured between δ = 25 and 30 μm in series of force versus distance curves acquired at fixed positions with varied approach speed, normalized by the slope at 20 μm/s. Data represent the mean ± standard deviation from measurements on three COCs each, expanded in vivo (C) and in vitro (D).
Figure 3
Figure 3
Quantification of COC matrix elasticity. (A) Representative curves of force versus distance from contact point δ, acquired on top of the oocyte center of in vivo (left) and in vitro (right) expanded matrix (gray solid lines), fitted to the Hertz model over 0 ≤ δ ≤ 10 μm (black solid line) that yields values for Young’s modulus of 0.4 and 1.6 Pa, respectively. The black dotted line is an extrapolation of the fit, illustrating that the Hertz model does not reproduce data yielding large indentation values accurately, and that the matrix effectively stiffens upon compression. Data over 0 ≤ δ ≤ 12 μm are magnified (insets) to illustrate the quality of the fits. (B) Effective elastic moduli E′ for a COC expanded in vivo (solid squares) and in vitro (open circles). The force curves in (A) were downsampled to reduce scatter and then used for analysis. For 0 ≤ δ ≤ 10 μm, E′ was determined through a fit with Eq. 1; for δ > 10 μm, E′ was calculated with Eq. 2.
Figure 4
Figure 4
Determination of COC dimensions. (A) Heights, Hmech (determined mechanically from the contact point) and Hopt (determined optically from the location of the topmost cumulus cells), as a function of the distance from the oocyte center. Data represent the mean and standard deviations from measurements on three COCs; error bars are drawn along one direction only to facilitate visualization. (B) Illustration of the approximate dimensions of the COC matrix and the location of cumulus cells within it, as determined from the spatial mapping of Hmech and Hopt. The height of the oocyte above the substrate was determined optically. Oocyte and cumulus cell sizes are drawn to scale. (C) Elasticity of COCs expanded in vivo (left) and in vitro (right) as a function of distance from the oocyte center. Young’s moduli in the linear elastic regime (solid squares) were determined through a fit with Eq. 1 for δ < 10 μm; elastic moduli at δ = 30 μm (open circles) were calculated with Eq. 2. Data represent the mean ± standard deviation from measurements on three individual COCs, except at 200 μm where only two of three in vivo expanded COCs had a matrix and were analyzed. To see this figure in color, go online.

Comment in

References

    1. Russell D.L., Salustri A. Extracellular matrix of the cumulus-oocyte complex. Semin. Reprod. Med. 2006;24:217–227. - PubMed
    1. Salustri A., Yanagishita M., Hascall V.C. Localization and synthesis of hyaluronic acid in the cumulus cells and mural granulosa cells of the preovulatory follicle. Dev. Biol. 1992;151:541–551. - PubMed
    1. Chen L., Mao S.J., Larsen W.J. Identification of a factor in fetal bovine serum that stabilizes the cumulus extracellular matrix. A role for a member of the inter-alpha-trypsin inhibitor family. J. Biol. Chem. 1992;267:12380–12386. - PubMed
    1. Salustri A., Garlanda C., Mantovani A. PTX3 plays a key role in the organization of the cumulus oophorus extracellular matrix and in in vivo fertilization. Development. 2004;131:1577–1586. - PubMed
    1. Fülöp C., Szántó S., Mikecz K. Impaired cumulus mucification and female sterility in tumor necrosis factor-induced protein-6 deficient mice. Development. 2003;130:2253–2261. - PubMed

Substances