. 2016 Jul 7;375(1):44-53.
doi: 10.1056/NEJMsa1514387. Epub 2016 Jun 22.

State Legal Restrictions and Prescription-Opioid Use among Disabled Adults

Affiliations

State Legal Restrictions and Prescription-Opioid Use among Disabled Adults

Ellen Meara et al. N Engl J Med. .

Abstract

Background: In response to rising rates of opioid abuse and overdose, U.S. states enacted laws to restrict the prescribing and dispensing of controlled substances. The effect of these laws on opioid use is unclear.

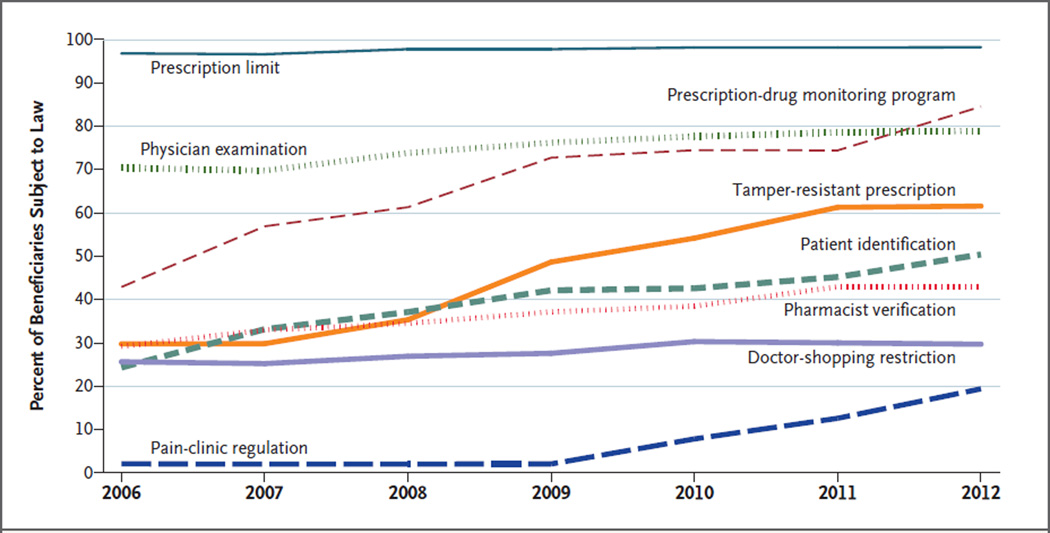
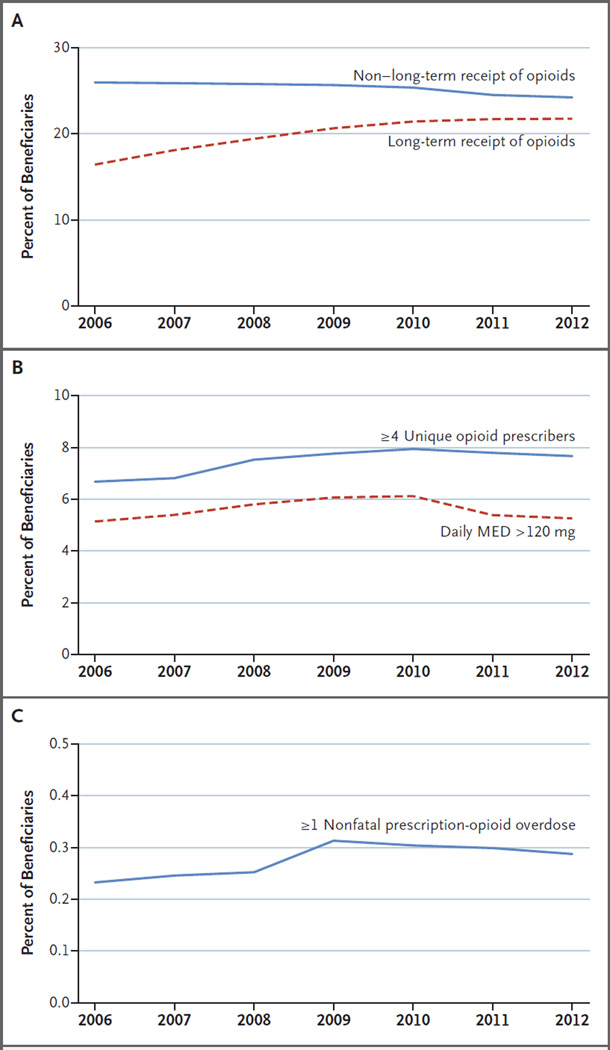
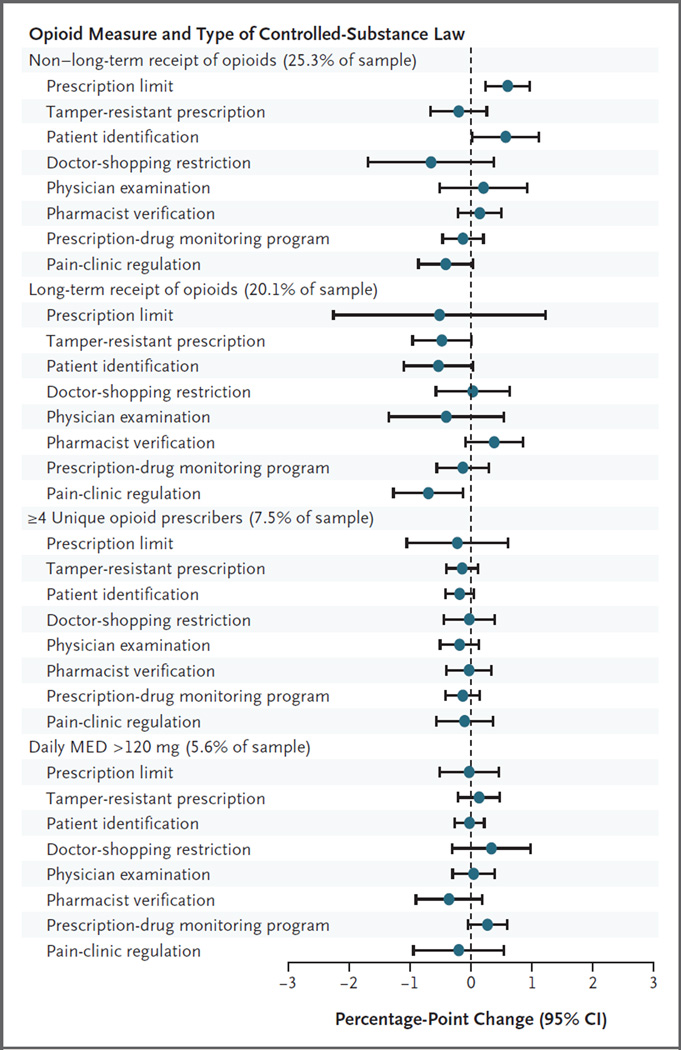
Methods: We tested associations between prescription-opioid receipt and state controlled-substances laws. Using Medicare administrative data for fee-for-service disabled beneficiaries 21 to 64 years of age who were alive throughout the calendar year (8.7 million person-years from 2006 through 2012) and an original data set of laws (e.g., prescription-drug monitoring programs), we examined the annual prevalence of beneficiaries with four or more opioid prescribers, prescriptions yielding a daily morphine-equivalent dose (MED) of more than 120 mg, and treatment for nonfatal prescription-opioid overdose. We estimated how opioid outcomes varied according to eight types of laws.

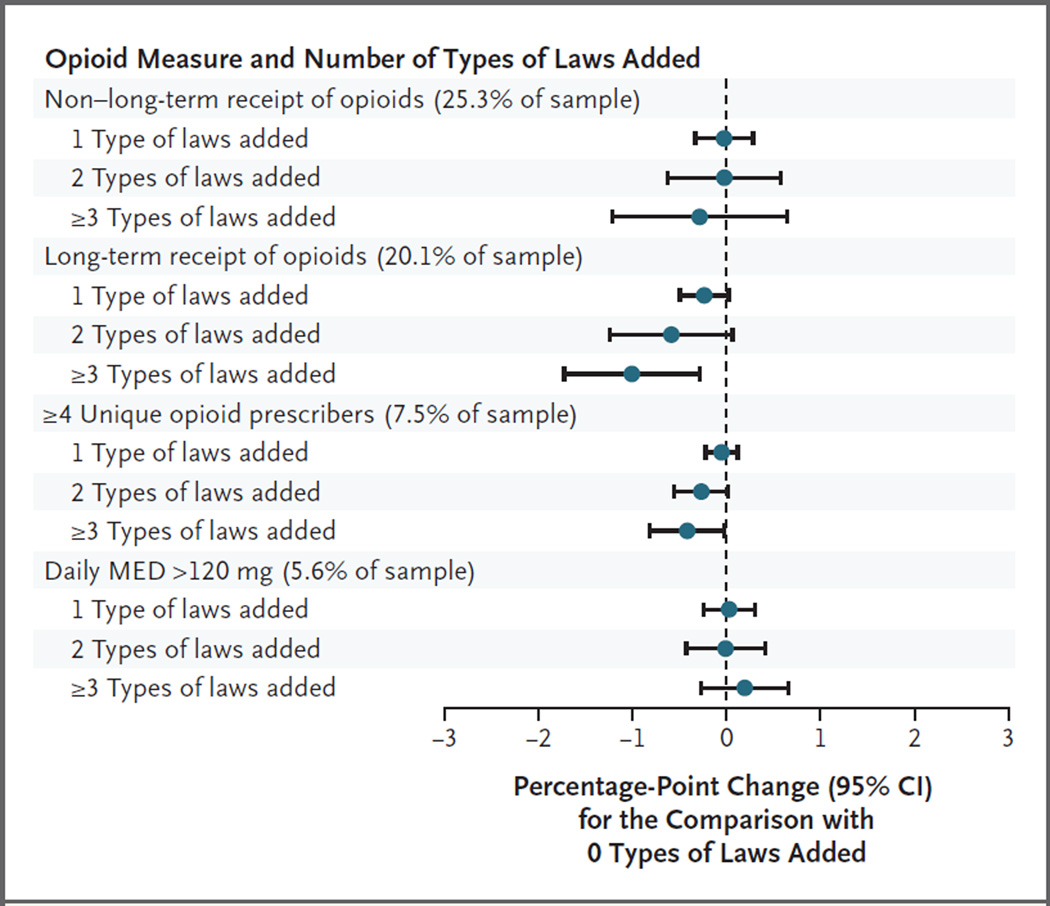
Results: From 2006 through 2012, states added 81 controlled-substance laws. Opioid receipt and potentially hazardous prescription patterns were common. In 2012 alone, 47% of beneficiaries filled opioid prescriptions (25% in one to three calendar quarters and 22% in every calendar quarter); 8% had four or more opioid prescribers; 5% had prescriptions yielding a daily MED of more than 120 mg in any calendar quarter; and 0.3% were treated for a nonfatal prescription-opioid overdose. We observed no significant associations between opioid outcomes and specific types of laws or the number of types enacted. For example, the percentage of beneficiaries with a prescription yielding a daily MED of more than 120 mg did not decline after adoption of a prescription-drug monitoring program (0.27 percentage points; 95% confidence interval, -0.05 to 0.59).

Conclusions: Adoption of controlled-substance laws was not associated with reductions in potentially hazardous use of opioids or overdose among disabled Medicare beneficiaries, a population particularly at risk. (Funded by the National Institute on Aging and others.).


Figures

Figure 1
Figure 1. Percentage of Sample Medicare Beneficiaries 21 to 64 Years of Age Who Were Living in a State with Controlled-Substance Prescribing and Dispensing Laws, 2006–2012
With respect to 8 types of controlled-substance laws, the mean (±SD) types of laws per state increased from 2.7±1.5 (range, 0 to 6) in 2006 to 4.3±1.4 (range, 1 to 8) in 2012. Prescription limits, added by 2 states between 2006 and 2012, restrict the quantity dispensed. Prescription-drug monitoring programs, added by 19 states, collect data on controlled-substance dispensing for use by authorized personnel. Physician-examination restrictions, added by 12 states, require an established physician–patient relationship or physical examination before the prescription of controlled substances. Laws requiring tamper-resistant prescription forms were added by 19 states. Patient identification requirements, added by 13 states, mandate or permit pharmacists to ask for identification. Pharmacist-verification requirements, added by 8 states, prohibit pharmacists from dispensing controlled substances if there is suspicion that no doctor–patient relationship exists. Doctor-shopping restrictions, added by 4 states, prohibit patients from obtaining controlled substances through fraudulent behavior. Pain-clinic regulations, added by 4 states, affect the licensing and registration of prescribers.
Figure 2
Figure 2. Trends in Annual Prescription-Opioid Measures, 2006–2012
Long-term receipt was defined as the filling of one or more opioid prescriptions in each calendar quarter in a given year, and non–long-term receipt was defined as receipt in one, two, or three quarters (Panel A). A daily morphine-equivalent dose (MED) of more than 120 mg (Panel B) equals 1 when the daily MED (total quarterly MED divided by 91) exceeds 120 mg in any quarter during the calendar year. Nonfatal prescription-opioid overdose (Panel C) excludes beneficiaries with any observed heroin overdose in the calendar year.
Figure 3
Figure 3. Estimated Difference in Opioid Measures Associated with Individual Types of Controlled-Substance Laws
This figure shows adjusted estimates of the association between state-level controlled-substance laws and measures of opioid receipt. We estimated marginal effects (the change in the predicted probability of the dependent variable was multiplied by 100 for ease of presentation) on the basis of individual-level logistic regressions of annual prescription-opioid measures on time-varying individual types of laws in place in a given state in a given year, controlling for the state of residence, year indicators, and beneficiary characteristics. Variance estimates account for autocorrelation of observations within states over time with the use of Huber–White sandwich estimators. Confidence intervals were estimated with the use of the delta method and were not adjusted for multiple comparisons.
Figure 4
Figure 4. Estimated Difference in Opioid Measures Associated with Number of Types of State Controlled-Substance Laws Added since 2006
This figure shows adjusted estimates of the association between the number of types of state-level controlled-substance laws added since 2006 and measures of opioid receipt. We estimated marginal effects (the change in the predicted probability of the dependent variable was multiplied by 100 for ease of presentation) on the basis of individual-level logistic regressions of prescription-opioid measures on the time-varying number of types of laws added since 2006 (1, 2, or ≥3; 0 is the reference) in a beneficiary’s state of residence in a given year, controlling for the state of residence, year indicators, and beneficiary characteristics. Variance estimates account for autocorrelation of observations within states over time with the use of Huber–White sandwich estimators. Confidence intervals were estimated with the use of the delta method and were not adjusted for multiple comparisons.

Comment in

References

    1. Dart RC, Surratt HL, Cicero TJ, et al. Trends in opioid analgesic abuse and mortality in the United States. N Engl J Med. 2015;372:241–248. - PubMed
    1. Morden NE, Munson JC, Colla CH, et al. Prescription opioid use among disabled Medicare beneficiaries: intensity, trends, and regional variation. Med Care. 2014;52:852–859. - PMC - PubMed
    1. Compton WM, Jones CM, Baldwin GT. Relationship between nonmedical prescription-opioid use and heroin use. N Engl J Med. 2016;374:154–163. - PMC - PubMed
    1. Rutkow L, Chang HY, Daubresse M, Webster DW, Stuart EA, Alexander GC. Effect of Florida’s prescription drug monitoring program and pill mill laws on opioid prescribing and use. JAMA Intern Med. 2015;175:1642–1649. - PubMed
    1. Haegerich TM, Paulozzi LJ, Manns BJ, Jones CM. What we know, and don’t know, about the impact of state policy and systems-level interventions on prescription drug overdose. Drug Alcohol Depend. 2014;145:34–47. - PMC - PubMed

Publication types

Substances