. 2016 Jun 21;44(6):1325-36.
doi: 10.1016/j.immuni.2016.06.006.

Type 1 Interferons Induce Changes in Core Metabolism that Are Critical for Immune Function

Affiliations

Type 1 Interferons Induce Changes in Core Metabolism that Are Critical for Immune Function

Duojiao Wu et al. Immunity. .

Abstract

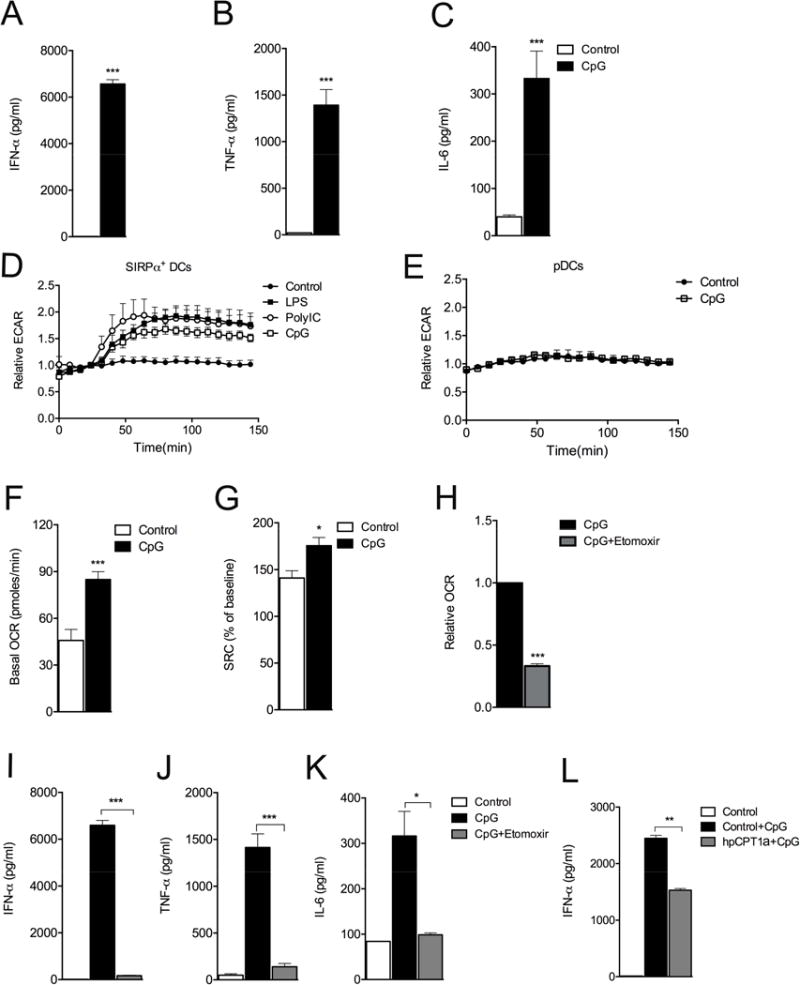
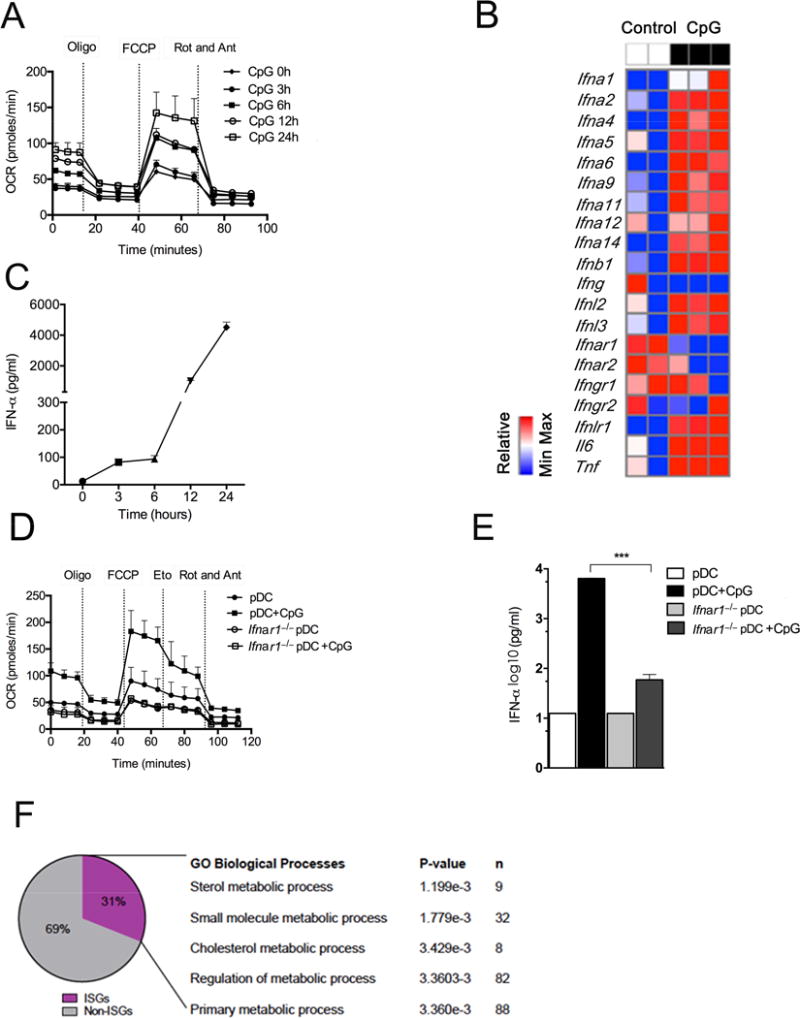
Greater understanding of the complex host responses induced by type 1 interferon (IFN) cytokines could allow new therapeutic approaches for diseases in which these cytokines are implicated. We found that in response to the Toll-like receptor-9 agonist CpGA, plasmacytoid dendritic cells (pDC) produced type 1 IFNs, which, through an autocrine type 1 IFN receptor-dependent pathway, induced changes in cellular metabolism characterized by increased fatty acid oxidation (FAO) and oxidative phosphorylation (OXPHOS). Direct inhibition of FAO and of pathways that support this process, such as fatty acid synthesis, prevented full pDC activation. Type 1 IFNs also induced increased FAO and OXPHOS in non-hematopoietic cells and were found to be responsible for increased FAO and OXPHOS in virus-infected cells. Increased FAO and OXPHOS in response to type 1 IFNs was regulated by PPARα. Our findings reveal FAO, OXPHOS and PPARα as potential targets to therapeutically modulate downstream effects of type 1 IFNs.


Conflict of interest statement

Competing financial interests

The authors declare no competing financial interests.

Figures

Figure 1
Figure 1. Stimulation of pDCs by CpGA results in an increase in FAO that is essential for cellular activation
CD11cintB220+Siglec H+ pDCs were sorted from Flt3L-bone marrow cultures at day 8, and stimulated with TLR agonists. (A) IFN-α was measured by ELISA at 24h post activation. (B) IL-6 and (C) TNF-α were measured in the same samples using CBA. (D,E) ECAR of SIRPα+DCs (D) and pDCs (E), following treatment with TLR agonists, were determined by EFA. (F) Basal OCR, and (G) SRC were determined by EFA. (H,I,J,K) Relative basal OCR (I), or cytokine production (I–K) of pDCs activated with CpGA without or with etomoxir. (L) IFNα production by pDCs transduced with retrovirus encoding either shRNA against luciferase (control) or CPT1a (hpCPT1a) and stimulated without or with CpGA. In D and E, data are mean ± SEM of reads from triplicate samples from one experiment, and are representative of data from 3 experiments. In the other panels, data are mean ± SEM from at least 3 independent experiments. All differences are statistically significant (at least P< 0.05, Student’s t-test); *, P < 0.05; **, P < 0.01; ***, P < 0.001. Please see Figure S1.
Figure 2
Figure 2. Stimulation of pDCs with CpGA results in type 1 IFN production that plays an essential role in subsequent changes in cellular metabolism and activation
(A)Mitochondrial fitness tests were used to compare OCR of pDCs stimulated with CpGA for times indicated. Data represent mean ± SEM of reads from triplicate samples from one experiment, and are representative of data from 3 experiments. (B) RNAseq analysis of Type 1 IFNs, Il6 and Tnf expression induced in pDCs by CpGA stimulation for 24h. Data from 2 separate control and 3 separate CpGA-stimulated cell samples are shown. (C) IFN-α accumulation in pDC culture supernatant at times indicated post activation with CpGA. Data are mean ± SEM from 3 independent samples from one experiment, and are representative of data from 4 experiments. (D) Mitochondrial fitness tests were used to compare OCR of resting or CpGA-stimulated WT or Ifnar1−/− pDCs. Data are mean ± SEM of reads from triplicate samples from one experiment, and are representative of data from 3 experiments. (E) IFN-α production by resting or CpGA-stimulated WT or Ifnar1−/− pDCs. Bars represent mean ± SEM of 3 independent experiments. (F) Genes expressed differentially in CpGA-activated vs. resting pDCs were identified by analysis of RNAseq data. This dataset was analyzed using INTERFEROME. The subset of ISGs was analyzed for GO biological processes using DAVID. All differences shown are statistically significant (at least P < 0.05, Student’s t-test); *, P < 0.05; **, P < 0.01; ***, P < 0.001. Please see Figure S2.
Figure 3
Figure 3. IFN-α directly promotes FA oxidation
(A) Mitochondrial fitness tests were used to compare OCR of WT and Ifnar1−/− pDCs stimulated with IFN-α, as indicated. (B) OCR values during a mitochondrial fitness test, (C) basal OCR, and (D) maximal OCR of PDV epithelial cells that had been cultured without (control) or with IFN-α for 24 h. (E) OCR values during a mitochondrial fitness test, and (F) basal OCR comparison, of PDV epithelial cells that had been cultured without (control) or with IFN-α or IFN-α plus anti-IFNAR (MAR1-5A3) for 24 h. Data are mean ± SEM of reads from triplicate samples from one experiment representative of 3 (A,B,E), or mean values ± SEM from 3 or more independent experiments (C,D,F). All differences shown are statistically significant (at least P < 0.05, Student’s t-test); *, P < 0.05; **, P < 0.01; ***, P < 0.001. Please see Figure S3.
Figure 4
Figure 4. Viral infection induces type 1 IFN-dependent changes in host cell FAO that are important for further type 1 IFN production and anti-viral effects
(A) OCR values during a mitochondrial fitness test of uninfected PDV epithelial cells versus PDV cells infected LCMV Arm for 24 h. (B) Basal OCR of PDV cells at 24 h post infection in the absence or presence of blocking anti-IFNAR Ab. (C,D) C57BL/6J mice were infected with 2 × 10⁵ PFU of LCMV Arm and treated with etomoxir (20 mg/kg) 1 day prior to infection and 1 day afterwards. Serum and tissue were collected at 72 h post-infection and (C) serum IFN-α, and (D) expression of LCMV glycoprotein (LCMV gp) in liver and spleen were measured. Data are mean ± SEM of reads from triplicate samples from one experiment representative of 3 (A), or mean ± SEM of reads from 3 independent experiments (B-E). All differences shown are statistically significant (at least P < 0.05, Student’s t-test); *, P < 0.05; **, P < 0.01; ***, P < 0.001. Please see Figure S4.
Figure 5
Figure 5. pDC activation is associated with a late increase in glycolysis and requires mitochondrial pyruvate import, and FAS
Purified pDCs were stimulated with CpGA plus or minus inhibitors for 24 h. (A) Relative change in basal ECAR at 24h post activation with CpGA. (B,C) Effect of the MPC inhibitor UK5099 on IFN-α and TNF-α production by CpGA-stimulated pDCs. (D,E) Effect of the ACC1 inhibitor TOFA on IFN-α and TNF-α production by CpGA-stimulated pDCs. (F) Relative basal OCR of pDCs activated with CpGA without or with inhibitors. (G) Relative basal ECAR of resting pDCs or pDCs stimulated with IFNα for 24 h. (H,I). Relative basal OCR of pDCs (H) or PDV cells (I) stimulated with IFN-α in the absence or presence of inhibitors. For all panels, data are mean ± SEM from 3 independent experiments. All differences shown are statistically significant (at least P < 0.05, Student’s t-test); *, P < 0.05; **, P < 0.01; ***, P < 0.001. Please see Figure S5.
Figure 6
Figure 6. Metabolic reprogramming induced by type 1 IFN leads to enhanced ATP availability
ATP was measured in pDCs that had been stimulated under various conditions for 24 h: (A) Resting pDCs, or pDCs stimulated with CpGA alone or in the presence of MAR1-5A3 to block IFNAR, or with IFN-α, or (B) pDCs cultured alone or with the indicated inhibitors, or with CpG alone or with the indicated inhibitors. Data are mean ± SEM of reads from triplicate samples from one experiment, representative of 3. The statistical significance of differences in ATP, by Student’s t-test, are marked as follows: *, P < 0.05; **, P < 0.01; ***, P < 0.001.
Figure 7
Figure 7. PPARα responsive gene signature is present in response to stimulation with type I IFN and plays a central role in regulating changes in FA metabolism induced by this cytokine
Data from RNAseq analysis of resting pDCs vs. pDCs stimulated with IFN-α for 24 h were analyzed. (A) Differentially expressed genes (> 2-fold change) were analyzed to identify metabolic genes defined by RGD genes database (http://rgd.mcw.edu/rgdweb/search/genes.html), which were then examined further using DAVID focused on KEGG pathways. Pathways are color coded to match data in A. This set of differentially expressed metabolic genes was used to develop an interactive network of genes using STRING, that was annotated and modified using Cytoscape. Thicker edges represent interactions with higher support form published literature. KEGG pathways are color-highlighted as in A. Each circle represents an individual gene. Genes with more than one color are components of more than one pathway. (B) Based on the KEGG analysis in A, we specifically expanded the gene search for PPAR signaling pathways and built a network using the same strategy described in A. Individual gene names are shown. (B) Extracts of pDCs, treated as indicated, cDCs, or heart tissue, were separated by SDS-PAGE, transferred to a membrane and probed for PPARα and GAPDH (loading control). (D) Splenic pDCs were fixed and permeabilized, stained with an anti- PPARα antibody, and analyzed by flow cytometry. (E,F) pDCs were stimulated with CpG with or without the PPARα antagonist GW6471 for 24h, after which (E) IFN-α and (F) basal OCR were measured. (G) pDCs were stimulated with IFNα with or without GW6471 for 24h, after which OCR was measured. (H) OCR during a mitochondrial fitness test of PDV cells infected with LCMV Arm in the presence or absence of GW6471 for 24h. (I) Basal OCR of PDV cells infected with LCMV Arm in the presence or absence of GW6471 for 24h. (I) PDV cells were infected with LCMV for 24h in the presence or absence of IFN-α and/or GW6471, after which LCMV gp expression was measured by real time RT-PCR. The data in A and B are from RNAseq analysis of three samples of stimulated and three samples of unstimulated pDCs. Data in C and D are from individual experiments representative of 2 experiments. Data in H are mean ± SEM of reads from triplicate samples from one experiment representative of 3. Data in E-G, I, J are mean values ± SEM from 3 independent experiments. All differences shown are statistically significant (at least P < 0.05, Student’s t-test); *, P < 0.05; **, P < 0.01; ***, P < 0.001. Please see Figure S6.

Comment in

References

    1. Asselin-Paturel C, Brizard G, Chemin K, Boonstra A, O’Garra A, Vicari A, Trinchieri G. Type I interferon dependence of plasmacytoid dendritic cell activation and migration. J Exp Med. 2005;201:1157–1167. - PMC - PubMed
    1. Blanc M, Hsieh WY, Robertson KA, Watterson S, Shui G, Lacaze P, Khondoker M, Dickinson P, Sing G, Rodriguez-Martin S, et al. Host defense against viral infection involves interferon mediated down-regulation of sterol biosynthesis. PLoS Biol. 2011;9:e1000598. - PMC - PubMed
    1. Brand MD, Nicholls DG. Assessing mitochondrial dysfunction in cells. The Biochemical journal. 2011;435:297–312. - PMC - PubMed
    1. Clark K, Takeuchi O, Akira S, Cohen P. The TRAF-associated protein TANK facilitates cross-talk within the IkappaB kinase family during Toll-like receptor signaling. Proc Natl Acad Sci U S A. 2011;108:17093–17098. - PMC - PubMed
    1. Cline MS, Smoot M, Cerami E, Kuchinsky A, Landys N, Workman C, Christmas R, Avila-Campilo I, Creech M, Gross B, et al. Integration of biological networks and gene expression data using Cytoscape. Nature protocols. 2007;2:2366–2382. - PMC - PubMed

Publication types

MeSH terms