. 2016 Jun 21;44(6):1444-54.
doi: 10.1016/j.immuni.2016.05.014.

Engineered CAR T Cells Targeting the Cancer-Associated Tn-Glycoform of the Membrane Mucin MUC1 Control Adenocarcinoma

Affiliations

Engineered CAR T Cells Targeting the Cancer-Associated Tn-Glycoform of the Membrane Mucin MUC1 Control Adenocarcinoma

Avery D Posey Jr et al. Immunity. .

Abstract

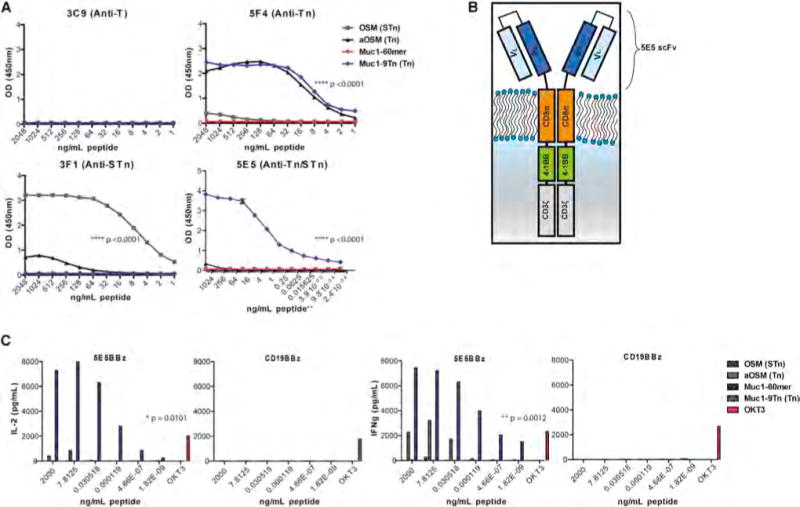
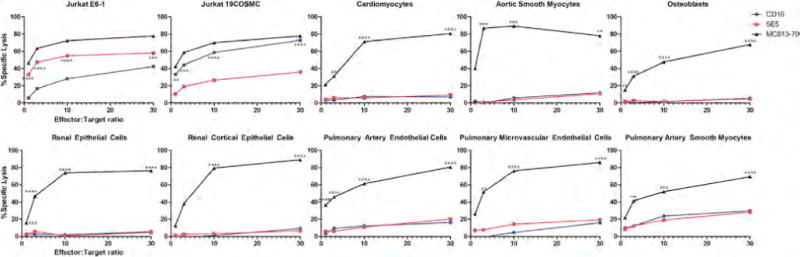
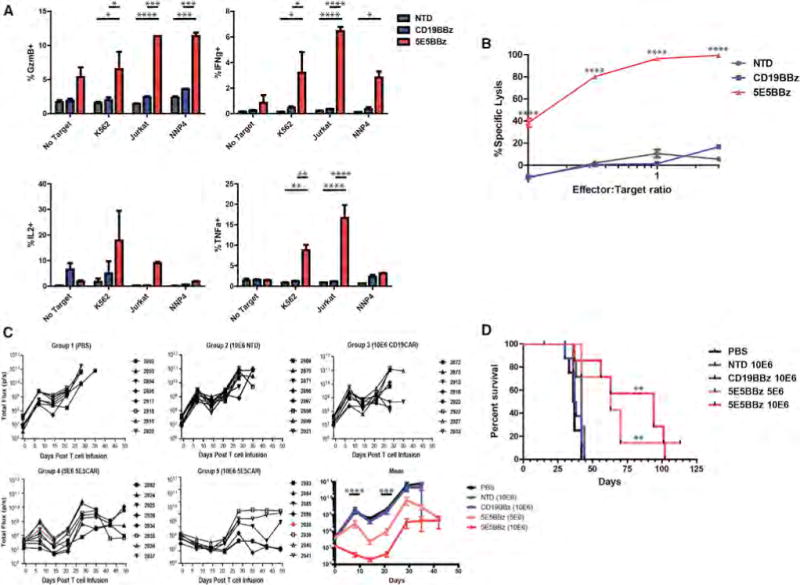
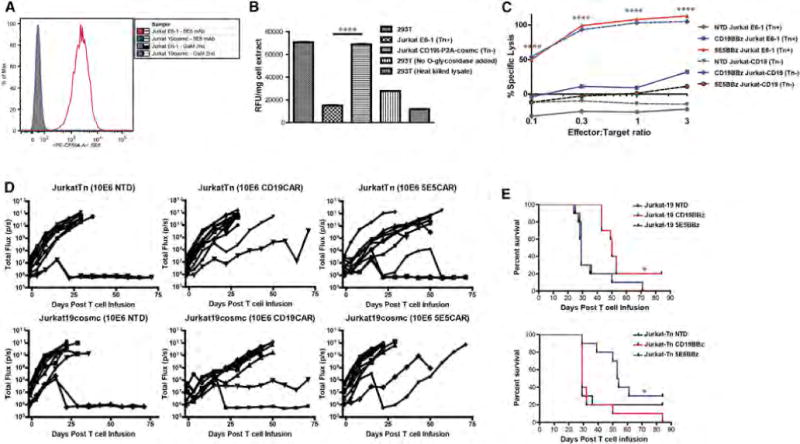
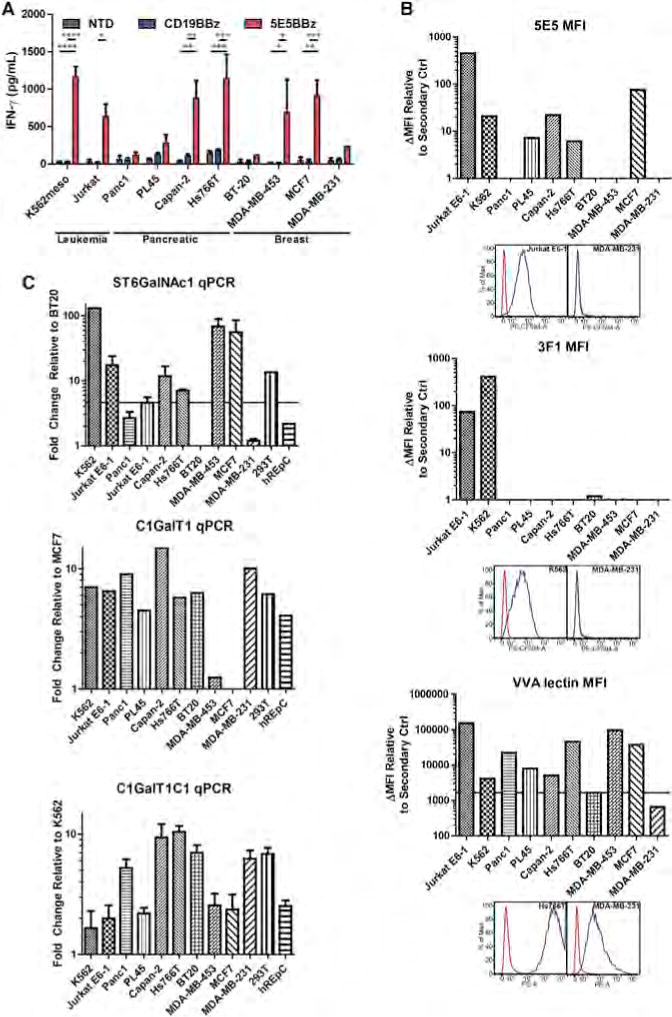
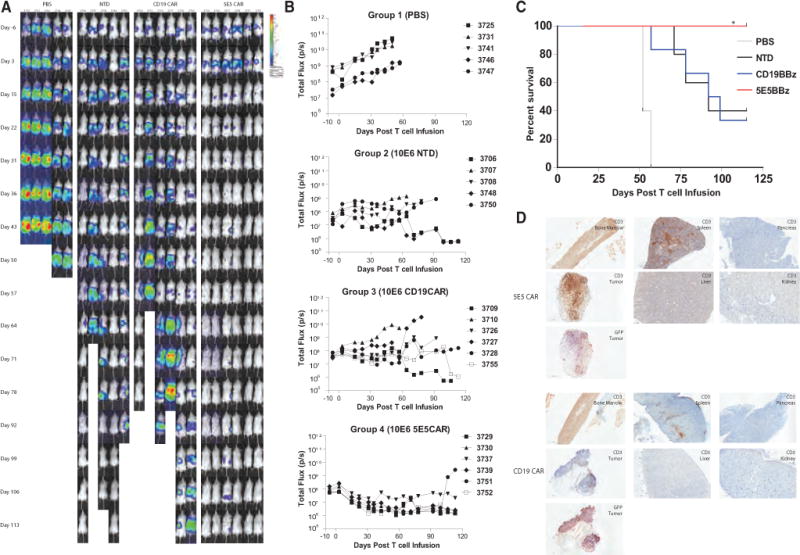
Genetically modified T cells expressing chimeric antigen receptors (CARs) demonstrate robust responses against lineage restricted, non-essential targets in hematologic cancers. However, in solid tumors, the full potential of CAR T cell therapy is limited by the availability of cell surface antigens with sufficient cancer-specific expression. The majority of CAR targets have been normal self-antigens on dispensable hematopoietic tissues or overexpressed shared antigens. Here, we established that abnormal self-antigens can serve as targets for tumor rejection. We developed a CAR that recognized cancer-associated Tn glycoform of MUC1, a neoantigen expressed in a variety of cancers. Anti-Tn-MUC1 CAR T cells demonstrated target-specific cytotoxicity and successfully controlled tumor growth in xenograft models of T cell leukemia and pancreatic cancer. These findings demonstrate the therapeutic efficacy of CAR T cells directed against Tn-MUC1 and present aberrantly glycosylated antigens as a novel class of targets for tumor therapy with engineered T cells.


Conflict of interest statement

This arrangement is managed in accordance with the University of Pennsylvania’s Conflict of Interest Policy. The authors are in compliance with this policy.

Figures

Figure 1
Figure 1. 5E5 mAb and 5E5 CAR Specifically Recognize the Tn-MUC1, but Not the Peptide Alone
(A) ELISA-peptide assay of glycopeptides OSM, aOSM, Muc1-9Tn, and unconjugated Muc1-60-mer with antibodies 3C9, 5F4, 3F1, and 5E5. The peptides were coated in the plate wells at concentrations of 2,000 ng/mL in bicarbonate buffer and halved in dilutions until 1 ng/mL. The bottom right panel used starting concentration of 2,000 ng/mL and diluted 8-fold until 233 fg/mL (noted with **). Statistical significance is calculated using an unpaired t test comparing 5F4 ELISA for Muc1-9Tn and Muc1-60-mer, 3F1 ELISA for OSM and aOSM, and 5E5 ELISA for Muc1-9Tn and Muc1-60-mer. p < 0.0001. (B) Graphical representation of the chimeric antigen receptor developed using the 5E5 scFv, CD8α hinge, and transmembrane domain, 4-1BB and CD3zeta endodomain. (C) Indirect ELISA assays quantifying the cytokine production in supernatant from 5E5 CAR and CD19 CAR T cells cultured on peptide-bound plates for 24 hr. Peptides were plated starting at concentrations of 2,000 ng/mL and diluted 256-fold until 1.82 ag/mL. 10 μg/mL of OKT3 mAb was used as a control T cell stimulant. Statistical significance of 5E5 CAR T cells on Muc1-9Tn versus Muc1-60-mer peptide is p = 0.0101 for IL-2 secretion and p = 0.0012 for IFN-γ secretion.
Figure 2
Figure 2. Evaluation of 5E5 CAR T Cells Reactivity to a Panel of Human Primary Cells
5E5 and CD19 CAR T cells were tested in a chromium release lysis assays at effector:target ratios of 1:1 to 30:1. MC813-70 CAR T cells known to exhibit normal tissue toxicity were used as a positive control. In addition the various CAR T cells were tested on wild-type Jurkat and Jurkat with reconstituted COSMC. Statistical comparisons are between 5E5 CAR and CD19 CAR in the positive controls Jurkat E6-1 and Jurkat 19COSMC. All other comparisons are made between MC813-70 and 5E5. ** = p < 0.01, *** = p < 0.001, **** = p < 0.0001.
Figure 3
Figure 3. Antitumor Efficacy of 5E5 CAR T Cells In Vitro and In Vivo
(A) Analysis of the cytokine-producing T cells from an intracellular cytokine assay of T cells, CAR-transduced or non-transduced (NTD), cultured with K562, K562-meso, Jurkat, and NNP4 cells. NNP4 is a sample of primary epithelial ovarian cancer cells obtained from a pleural tap. * = p < 0.05, ** = p < 0.01, *** = p < 0.001, **** = p < 0.0001. Data are plotted as mean ± SEM. (B) In vitro cytotoxicity assay of T cells, 5E5 CAR, CD19 CAR, or NTD, cultured with Jurkat cell line at the indicated effector-to-target ratios. **** = p < 0.0001 (C) Serial bioluminescence imaging of NSG mice injected intravenously with 5 × 10⁶ CBG+ Jurkat cells and infused with PBS or the indicated T cells, 1 × 10⁷ or 5 × 10⁶ cells as indicated, 8 days after tumor engraftment. Two mice, one in group 4 and one in group 5, died due to conditions not related to treatment and are indicated as red lines. The bottom right panel displays the mean bioluminescence by treatment group. n = 8 mice per group. See also Figure S4A. Statistical significance calculated between CD19 CAR and 5E5 CAR (5 × 10⁶ and 1 × 10⁷). There is no significance observed between 5 × 10⁶ and 1 × 10⁷ dose of 5E5 CAR. *** = p < 0.001, **** = p < 0.0001. (D) Kaplan-Meyer survival curve of mice bearing Jurkat tumor by treatment group. Median survival of PBS group = 36.5, NTD group = 42, CD19 CAR group = 37.5, 5 × 10⁶ 5E5 CAR group = 63 and 1 × 10⁷ 5E5 CAR group = 94 days post T cell infusion. Comparison of survival of CD19 CAR group to 5 × 10⁶ 5E5 CAR group is p = 0.0016 and for 1 × 10⁷ 5E5 CAR group is p = 0.0014. No statistical significance between 5E5 CAR doses.
Figure 4
Figure 4. Restoration of COSMC Expression Eliminates 5E5 mAb Staining, Increases T Synthase Activity, and Prevents 5E5 CAR T Cell-Induced Cytotoxicity
(A) Histogram analysis of GFP+ Jurkat cells and GFP+ Jurkat CD19t-P2A-COSMC cells stained with Goat-anti-mouse-PE alone or 5E5 mAb + GAM-PE. See also Figure S5A. (B) T synthase activity of cell extracts from 293T, Jurkat cells, and CD19t-P2A-cosmc Jurkat cells using an in vitro fluorescent assay. p < 0.0001. Data are plotted as mean ± SEM. (C) In vitro cytotoxicity assay of T cells, NTD, CD19BBz, or 5E5BBz, cultured with either Jurkat cells or Jurkat CD19t-P2A-COSMC cells at the indicated effector-to-target ratios. p < 0.0001. (D) Serial bioluminescence imaging of NSG mice injected intravenously with 5 × 10⁶ CBG+ Jurkat cells or Jurkat CD19t-P2A-COSMC cells and infused with 1 × 10⁷ of the indicated T cells 8 days after tumor engraftment. Each symbol represents one animal. n = 8 animals per group. See also Figure S4B. (E) Kaplan-Meyer survival curve of mice bearing Jurkat and CD19t-P2A-cosmc+ Jurkat tumors by treatment group. Median survival for Jurkat-19COSMC NTD group = 29, Jurkat-19COSMC CD19 CAR group = 50, and Jurkat-19COSMC 5E5 CAR group = 29 days post T cell infusion. Significance of overall survival for Jurkat-19COSMC experiment p = 0.0117. Median survival of Jurkat-Tn NTD group = 29, Jurkat-Tn CD19 CAR group = 29, and Jurkat-Tn 5E5 CAR group = 53.5 days post T cell infusion. Significance of overall survival for Jurkat-Tn experiment p = 0.0199.
Figure 5
Figure 5. 5E5 CAR T Cells Are Reactive against Multiple Tumor Histotypes, which Can Be Predicted from O-Glycophenotyping and O-Glycotransferase Expression
(A) Indirect ELISA quantifying T cell (NTD or transduced with the indicated CAR) secretion of IFN-γ during 24 hr culture with the indicated tumor cell lines. * = p < 0.05, ** = p < 0.01, *** = p < 0.001, **** = p < 0.0001. Data are plotted as mean ± SEM. (B) Cancer cell lines from A were immunostained with 5E5 mAb, 3F1 mAb, and VVA lectin and flow cytometric analysis was performed. Representative histograms of positive and negative cell lines are presented below each MFI plot. The ΔMFI was calculated by adjusting for MFI of secondary antibody stained cells and plotted accordingly. Cell lines stained brightly for 5E5, 3F1, or VVA lectin are likely to generate an immunostimulatory reaction from 5E5 CAR T cells. A caveat to this finding is the high VVA expression of Panc1 does not correlate with Figure 5A, yet Panc1 is known to not expression MUC1. (C) Relative quantitative PCR was performed on cDNA prepared from the cell lines evaluated in (A). Expression of ST6GalNAc1 mRNA correlated with cytokine secretion and reactivity of 5E5 CAR T cells to these cell lines. Expression of C1GalT1 (T synthase) was also severely reduced in breast cancer cell lines MDA-MB-453 and MCF7. T synthase is necessary to convert O-linked Tn antigens into Core 1 glycans. Also, low expression of C1GalT1C1 (Cosmc) mRNA is observed in 5E5 CAR-stimulating leukemia and breast cancer cell lines. Data are plotted as mean ± SEM.
Figure 6
Figure 6. 5E5 CAR T Cell-Treated Mice Exhibited Superior Tumor Rejection and Prolonged Survival against Disseminated Pancreatic Cancer
(A) Mice were injected with 1 × 10⁵ CBG+ Hs766T cells and imaged 6 days prior to T cell infusion and serially after treatment until 113 days post T cell infusion. (B) Serial bioluminescence of NSG mice injected intraperitoneally with 1 × 10⁵ CBG+ Hs766T metastatic pancreatic cancer cell line and infused with PBS or 106 of the indicated T cells when the mean tumor bioluminescence was in the 107–108 p/s range. (C) Kaplan-Meyer survival curve of mice bearing the Hs766T tumor by treatment group (N = 6 mice per CD19 CAR and 5E5 CAR groups, N = 5 mice per PBS and NTD groups). Median survival of CD19 CAR group is 95.5 days and undefined for 5E5 CAR group. Significance of survival between CD19 CAR and 5E5 CAR group is p = 0.0183. (D) Immunohistochemistry of bone marrow, spleen, pancreas, liver, kidney, and tumor from mice bearing Hs766T tumor subcutaneously and treated with CD19 CAR or 5E5 CAR. Anti-human CD3 staining revealed human T cells in the bone marrow and spleen of all mice. Tumors from mice treated with 5E5 CAR T cells contained significantly more T cells than mice treated with CD19 CAR T cells.

Comment in

References

    1. Andrulis M, Ellert E, Mandel U, Clausen H, Lehners N, Raab MS, Goldschmidt H, Schwartz-Albiez R. Expression of Mucin-1 in multiple myeloma and its precursors: correlation with glycosylation and sub-cellular localization. Histopathology. 2014;64:799–806. - PubMed
    1. Bennett EP, Mandel U, Clausen H, Gerken TA, Fritz TA, Tabak LA. Control of mucin-type O-glycosylation: a classification of the polypeptide GalNAc-transferase gene family. Glycobiology. 2012;22:736–756. - PMC - PubMed
    1. Berger EG. Tn-syndrome. Biochim Biophys Acta. 1999;1455:255–268. - PubMed
    1. Borgert A, Heimburg-Molinaro J, Song X, Lasanajak Y, Ju T, Liu M, Thompson P, Ragupathi G, Barany G, Smith DF, et al. Deciphering structural elements of mucin glycoprotein recognition. ACS Chem Biol. 2012;7:1031–1039. - PMC - PubMed
    1. Brentjens RJ, Davila ML, Riviere I, Park J, Wang X, Cowell LG, Bartido S, Stefanski J, Taylor C, Olszewska M, et al. CD19-targeted T cells rapidly induce molecular remissions in adults with chemotherapy-refractory acute lymphoblastic leukemia. Sci Transl Med. 2013;5:177ra38. - PMC - PubMed

Publication types

MeSH terms