. 2016 Jul:9:257-277.
doi: 10.1016/j.ebiom.2016.05.011. Epub 2016 May 13.

Upregulation of Haploinsufficient Gene Expression in the Brain by Targeting a Long Non-coding RNA Improves Seizure Phenotype in a Model of Dravet Syndrome

Affiliations

Upregulation of Haploinsufficient Gene Expression in the Brain by Targeting a Long Non-coding RNA Improves Seizure Phenotype in a Model of Dravet Syndrome

J Hsiao et al. EBioMedicine. 2016 Jul.

Abstract

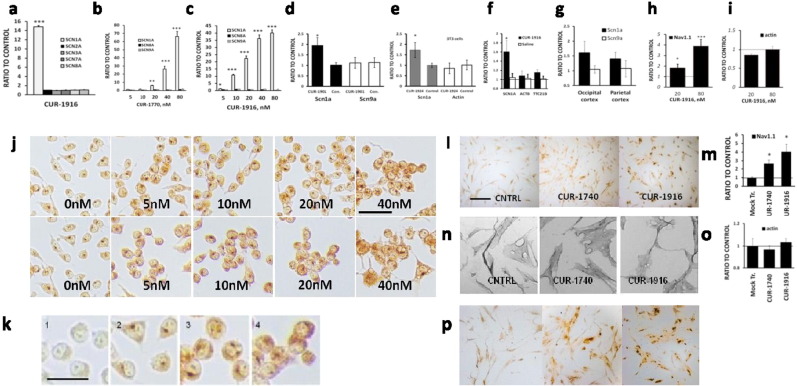
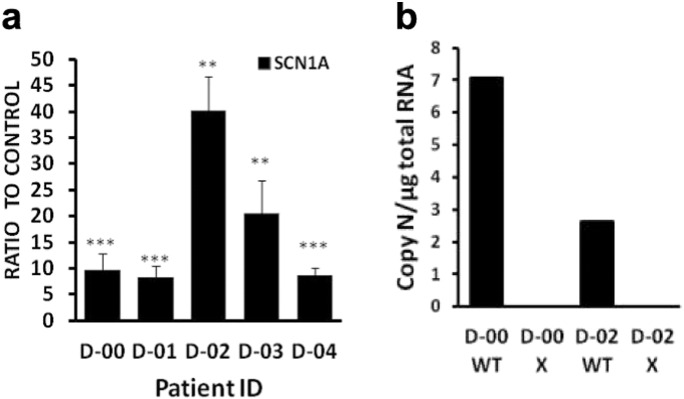
Dravet syndrome is a devastating genetic brain disorder caused by heterozygous loss-of-function mutation in the voltage-gated sodium channel gene SCN1A. There are currently no treatments, but the upregulation of SCN1A healthy allele represents an appealing therapeutic strategy. In this study we identified a novel, evolutionary conserved mechanism controlling the expression of SCN1A that is mediated by an antisense non-coding RNA (SCN1ANAT). Using oligonucleotide-based compounds (AntagoNATs) targeting SCN1ANAT we were able to induce specific upregulation of SCN1A both in vitro and in vivo, in the brain of Dravet knock-in mouse model and a non-human primate. AntagoNAT-mediated upregulation of Scn1a in postnatal Dravet mice led to significant improvements in seizure phenotype and excitability of hippocampal interneurons. These results further elucidate the pathophysiology of Dravet syndrome and outline a possible new approach for the treatment of this and other genetic disorders with similar etiology.

Keywords: AntagoNAT; Dravet syndrome; Long non-coding RNA; Natural antisense transcript; Oligonucleotide-based compound; SCN1A.


Figures

Fig. 1
Fig. 1
SCN1A and SCN1ANAT coding regions are localized on opposite chromosomal strands in human and mouse genomes. (a) Human chromosome 2. (b) Mouse chromosome 2. In the insets: empty boxes — SCN1ANAT exons; filled boxes — SCN1A exons; grey lines — complementary chromosomal strands; angled arrows — direction of transcription; CUR-1916, CUR-1901 — positions of sequences complementary to respective AntagoNATs.
Fig. 2
Fig. 2
Summary of AntagoNAT screening data. Bars show fold difference in the SCN1A mRNA expression levels between mock-transfected controls and cells treated with 20 nM of AntagoNATs of different chemistry and sequence. Boxes point to AntagoNATs selected for in-depth studies based on their high SCN1A upregulation and effect consistency in different cell lines. For mouse, homology to human AntagoNATs was also taken into account. Each bar represents an average of 2 or more experiments in 2 different cell lines (HepG2 and SK-N-AS cells for human, 3T3 and Neuro2a cells for mouse-specific AntagoNATs, n = 10 or higher). Real time PCR data. Mean ± S.E.M. * — p < 0.05.
Fig. 3
Fig. 3
SCN1A and SCN1ANAT expression in human, monkey and mouse tissues. (a) Expression of SCN1ANAT in a human tissue panel, normalized to arbitrary RNA standard. (b) Correlation of expression levels of Scn1a and Scn1aNAT in African green monkey tissues (n = 4, df = 20, F = 29.5; tissues as listed in (e), dark circles — peripheral organs, lighter circles — spinal cord, light circles — brain regions). (c) Ratio of Scn1a to Scn1aNAT expression in mouse tissues, n = 4. (d) Ratio of Scn1a to Scn1aNAT expression in mouse cell lines. (e–g) Expression levels of Scn1a and Scn1aNAT in African green monkey tissues, n = 4: (e) — Scn1a mRNA. (f) — Scn1aNAT RNA. (g) — Ratios of Scn1a to Scn1aNAT copy numbers. (h–j) — Enlarged portions of e, f, g respectively showing data for peripheral organs. Real time PCR data. Mean ± S.E.M.
Fig. 4
Fig. 4
Target specificity of NAT-mediated SCN1A upregulation. (a) SCN1A mRNA in SK-N-AS cells treated with a mixture of active AntagoNAT (CUR-1837) and a control oligonucleotide (CUR-1462); ANOVA p < 0.01, n = 3–5. (b) Vero76 cells treated with a mixture of an active AntagoNAT (CUR-1916) and control oligonucleotide (CUR-1462); ANOVA p < 0.05, n = 5/group, representative of 4 experiments. (c) SCN1A mRNA levels in SK-N-AS cells treated with 20 nM of an active AntagoNAT (CUR-1916) or inactive oligonucleotides of different sequence and chemistry (except CUR-1462_40 at 40 nM; ANOVA p < 0.001, n = 6/group, representative of 11 experiments). Real time PCR data. Mean ± S.E.M., * — p < 0.05, ** — p < 0.01, *** — p < 0.001.
Fig. 5
Fig. 5
Treatment with AntagoNATs did not affect expression of highly homologous alpha subunits of sodium channels and unrelated genes. (a) Human SK-N-AS cells, 20 nM CUR-1916 (n = 5, p < 0.001 for Scn1a). (b, c) Dravet patient fibroblasts D-00 treated with different concentrations of (b) CUR-1770 or (c) CUR-1916; real time PCR data, ANOVA, p < 0.05 for SCN1A, p > 0.05 for other genes, n = 5/group. (d, e) mouse 3T3 cells (n = 10/group, p < 0.02 for Scn1a), (f) monkey temporal cortex in vivo (n = 9, p < 0.01 for Scn1a), (g) Dravet mouse brain invivo (n = 9, p < 0.01 for Scn1a, t-test with Bonferroni correction, p > 0.3 for all other genes). (h, i) Protein levels in Vero76 cells after treatment with CUR-1916: (h) Nav1.1 and (i) actin (ELISA, n = 3, 1-factor ANOVA p > 0.05 for actin, p < 0.05 for Scn1a). (j) IHC staining for Nav1.1 after treatment of Neuro2a cells with CUR-1901 (top panel and CUR-1924 (bottom), (k) magnification of (j), 1 — no primary antibody, 2–0 nM, 3.4–40 nM of CUR-1901 or CUR-1924 respectively. (l–p) — Treatment of Dravet fibroblasts with 80 nM of AntagoNATs upregulates Nav1.1 (l, m, p) but not actin (n, o) protein levels (IHC staining, NIS-ElementsD3.0 software, n = 4, 2-factor ANOVA p  < 0.05 for actin, p < 0.05 for Scn1a). Mean ± S.E.M., * — p < 0.05, ** — p < 0.01, *** — p < 0.001.
Fig. 6
Fig. 6
Secondary structure of SCN1ANAT. Blue triangles — low-activity, red triangles — high-activity AntagoNAT clusters. AntagoNATs inducing highest upregulation of SCN1A were located around positions 540 and 1018 (representative AntagoNATs CUR-1740 and CUR-1916 respectively). Color scale represents probability of occurrence of the secondary structure (blue — low, red — high). Generated using Vienna RNAfold software.
Fig. 7
Fig. 7
Mouse model of Dravet syndrome. (a) Localization of the E1099X mutation in the Scn1a protein structure. (b) Scn1a mRNA expression in Scn1a E1099X/+ mice compared to WT, real time PCR data, n = 3. (c) Example of a 12-hour long EEG recording showing typical seizure (square bracket), post-seizure depression (slim arrow) and inter-ictal activity (block arrows); representative of the 28-day continuous observation of > 30 mice (video in Supplementary File 3). Mean ± S.E.M. Mouse model of Dravet syndrome. (a) Localization of the E1099X mutation in the Scn1a protein structure. (b) Scn1a mRNA expression in Scn1a E1099X/+ mice compared to WT, real time PCR data, n = 3. (c) Example of a 12-hour long EEG recording showing typical seizure (square bracket), post-seizure depression (slim arrow) and inter-ictal activity (block arrows); representative of the 28-day continuous observation of > 30 mice (video in Supplementary File 3). Mean ± S.E.M.
Fig. 8
Fig. 8
SCN1A upregulation and seizure phenotype improvement in a mouse model of Dravet syndrome after AntagoNAT treatment in vivo. Mice were treated with 4 weekly injections of CUR-1901 at 20 μg/injection or saline. (a, b) Dose-dependent increase in Scn1a mRNA levels in brain regions of Scn1a E1099X/+ (a) or WT (b) mice (real time PCR data, normalized to vehicle control, ANOVA p < 0.05 for each brain region, stars show comparison to 0 μg). (c) Average number of seizures recorded during the 12 h light (LIGHT) or dark (DARK) periods, and TOTAL throughout the day (average over 28 days; n = 10 for CUR-1901, n = 11 for control, t-test with Bonferroni correction). (d) Total number of seizures from (a), symbols represent averages for individual animals. (e) Dose-dependent reduction in daily seizure numbers (regression p = 0.01). (g–i) Reduction in (g) seizure duration, (h) ictal amplitude and (i) post-ictal amplitude (n = 6 for CUR-1901, n = 5 for saline, t-test with Bonferroni correction). Mean ± S.E.M. * — p < 0.05, ** — p < 0.01.
Fig. 9
Fig. 9
Increase in seizure threshold temperature after CUR-1901 treatment. Scn1a E1099X/+ (a) or WT (b) mice were treated with 4 weekly injections of CUR-1901 at 20 μg/injection or saline. (n = 4.6, representative of 3 experiments, t-test p = 0.01). (c) Cumulative seizure probability vs core body temperature for WT and Scn1aE1099X/+ transgenic mice treated with CUR-1901 or vehicle (n = 3.3,6,5 respectively, representative of 3 experiments). (d) Power spectra of normal EEG (red trace), inter-ictal EEG (green trace), ictal EEG (blue trace) and post-ictal suppression EEG (black trace) in Scn1aE1099X/+ transgenic mice (n = 6).Mean ± S.E.M. ** — p < 0.01.
Fig. 10
Fig. 10
Normalization of neuronal activity in Dravet mice after CUR-1901 treatment. WT and Scn1a E1099X/+ mice were treated with a single IT injection of 5 μg of CUR-1901 or saline. (a) Representative traces of current clamp experiments in hippocampal parvalbumin-positive interneuron in WT and control Scn1a E1099X/+ mice (Het), compared to Scn1a E1099X/+ treated (Het_1901) mice. (b) Input/output function for (a). (c–i) Characteristics of hippocampal parvalbumin-positive neurons (n = 6.5.8 respectively): (c) half-width of action potential (AP); (d) rise slope of AP; (e) decay slope of AP; (f) amplitude of AP; (g) afterhyperpolarization (AHP) amplitude of AP; (h) input resistance; (i) resting potential (t-test with correction, p > 0.05). Mean ± S.E.M., * — p < 0.05, ** — p < 0.01.
Fig. 11
Fig. 11
Upregulation of SCN1A expression after AntagoNAT treatment of different Dravet mutations. (a) SCN1A mRNA levels in 5 Dravet patient fibroblast lines treated with 20 nM of CUR-1916; normalized to inactive oligonucleotide control, real time PCR data, t-test with Bonferroni correction, n = 18/group. (b) Copy numbers of WT and mutant (X) SCN1A mRNAs in fibroblast lines D-00 and D-02. Mutant mRNA was undetectable in both cell lines (allele-specific real time PCR with synthetic copy number standards, n = 3 wells/group). Mean ± S.E.M., ** — p < 0.01, *** — p < 0.001.
Fig. 12
Fig. 12
AntagoNAT distribution and Scn1a upregulation in vivo in African green monkeys. Animals were injected IT with different doses of CUR-1916. (a) Tissue concentration of CUR-1916 in monkey brain 7 days after injection (hybridization assay data). (b) CUR-1916 concentrations in different monkey brain regions after treatment with 0.04 mg/kg of CUR-1916 (hybridization assay data, n = 9). (c–f) Upregulation of Scn1a mRNA in brain regions (n = 6 for 0.008 mg/kg, n = 9 for 0 and 0.04 mg/kg of CUR-1916; real time PCR data, ANOVA p < 0.05). (g) Correlation of CUR-1916 concentration in tissues with Scn1a upregulation levels (regression p = 0.02). (h) Scn1a expression levels in peripheral organs in monkeys treated with 0.04 mg/kg of CUR-1916 (ANOVA p > 0.1, n = 6/group). (i–k) Scn1a mRNA expression levels in CNS regions of monkeys treated IT with 0.04 mg/kg of: (i) an inactive oligonucleotide CUR-1462 (normalized to saline control, ANOVA p = 0.21, n = 7 for CUR-1462, 9 for saline); (j) human-specific AntagoNAT CUR-1740 (normalized to CUR-1462, ANOVA p = 0.05, n = 4); (k) human-specific AntagoNAT CUR-1945 (normalized to CUR-1462, ANOVA p = 0.1, n = 4). Mean ± S.E.M., * — p < 0.05, # — p < 0.1. Mean ± S.E.M., * — p < 0.05.

References

    1. Bechi G., Scalmani P., Schiavon E., Rusconi R., Franceschetti S., Mantegazza M. Pure halopinsufficiency for Dravet syndrome Nav1.1 (SCN1A) sodium channel truncating mutations. Epilepsia. 2011 (1528-1167 PMID: 22150645) - PubMed
    1. Bender A.C., Natola H., Ndong C., Holmes G.L., Scott R.C., Lenck-Santini P.P. Focal Scn1a knockdown induces cognitive impairment without seizures. Neurobiol. Dis. 2013;54:297–307. (Jun PMID: 23318929) - PMC - PubMed
    1. Bender A.C., Luikart B.W., Lenck-Santini P.P. Cognitive deficits associated with Nav1.1 alterations: involvement of neuronal firing dynamics and oscillations. PLoS One. 2016;11(3):e0151538. (Mar 15, eCollection 2016. PMID: 26978272) - PMC - PubMed
    1. BrainSpan Atlas http://www.brainspan.org (accessed 05/02/2016)
    1. Cahoy J.D., Emery B., Kaushal A., Foo L.C., Zamanian J.L., Christopherson K.S., Xing Y., Lubischer J.L., Krieg P.A., Krupenko S.A., Thompson W.J., Barres B.A. A transcriptome database for astrocytes, neurons, and oligodendrocytes: a new resource for understanding brain development and function. J. Neurosci. 2008;28(1):264–278. (Jan 2) - PMC - PubMed

MeSH terms

Substances