Comparative Study
. 2016 Jul:9:336-345.
doi: 10.1016/j.ebiom.2016.05.031. Epub 2016 May 26.

Development of Upper Respiratory Tract Microbiota in Infancy is Affected by Mode of Delivery

Affiliations
Comparative Study

Development of Upper Respiratory Tract Microbiota in Infancy is Affected by Mode of Delivery

Astrid A T M Bosch et al. EBioMedicine. 2016 Jul.

Abstract

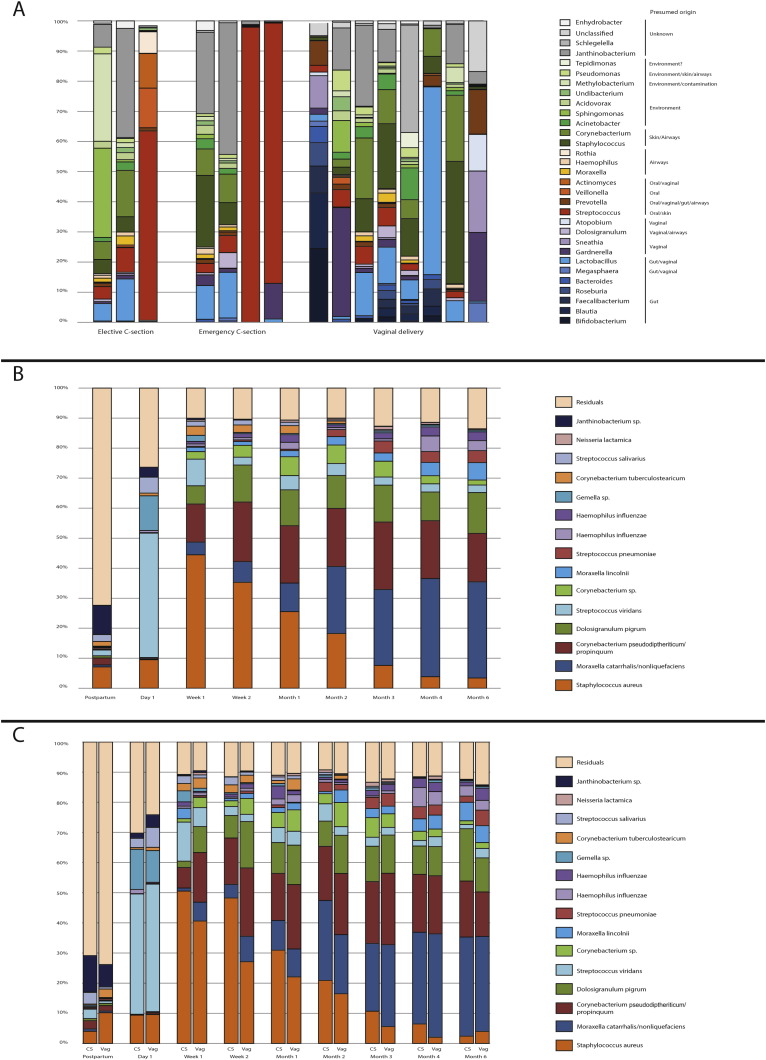
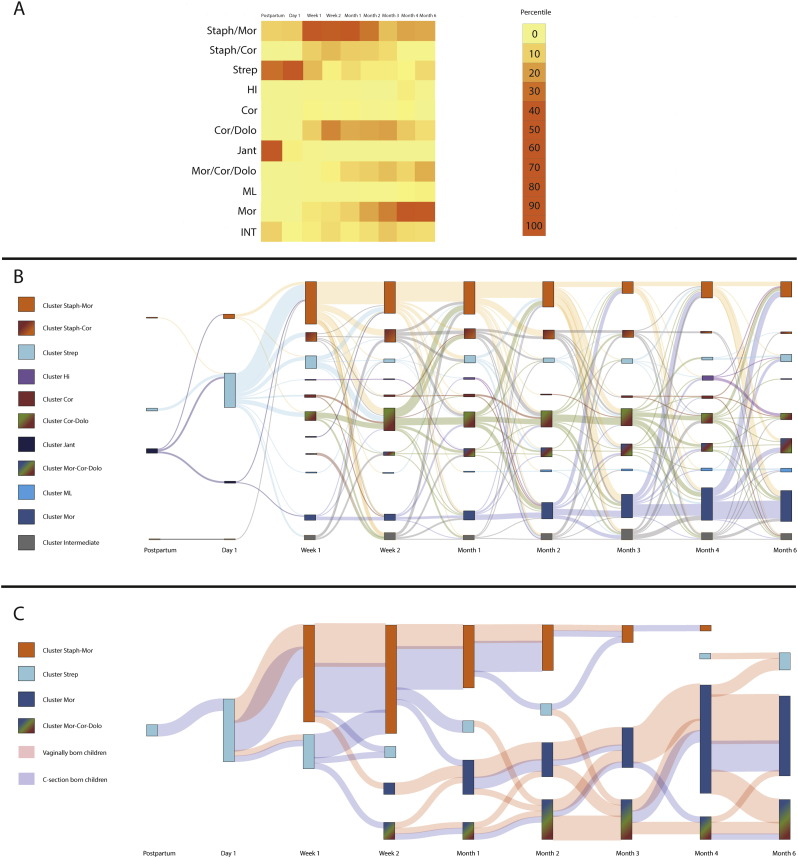
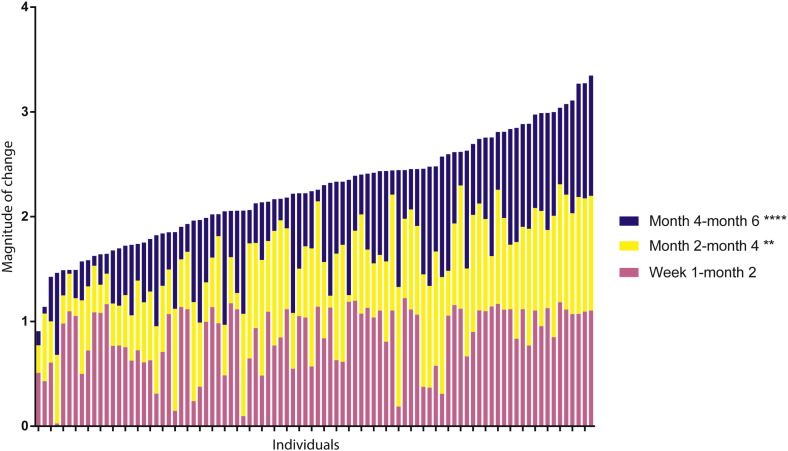
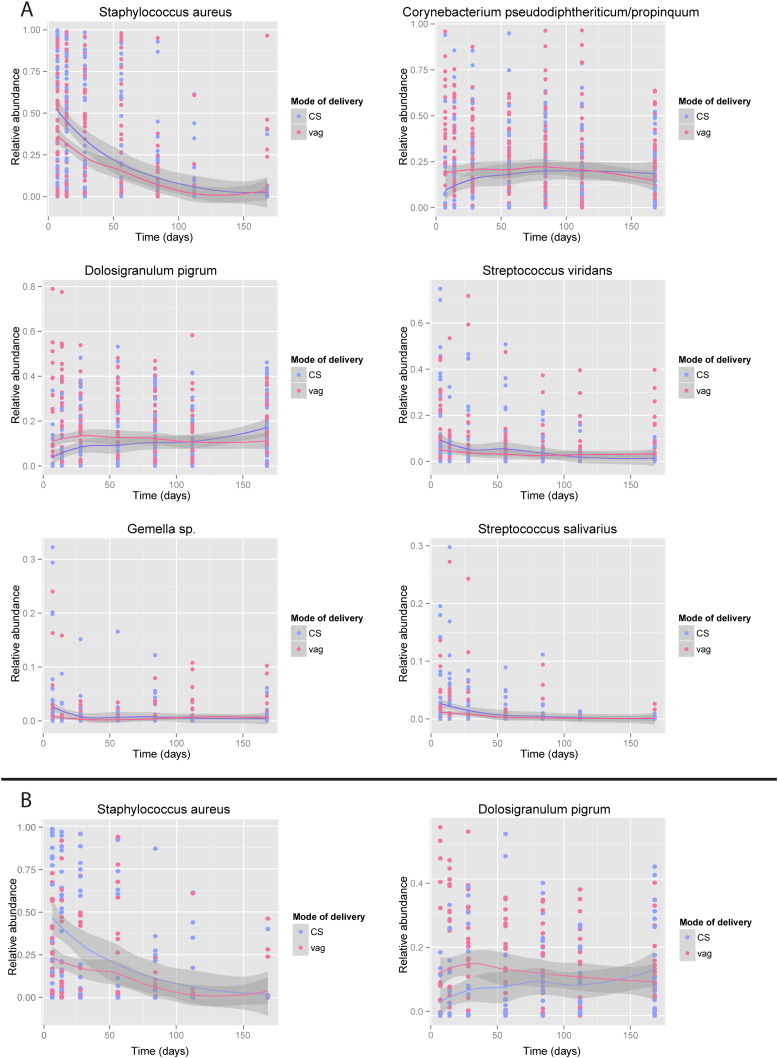
Birth by Caesarian section is associated with short- and long-term respiratory morbidity. We hypothesized that mode of delivery affects the development of the respiratory microbiota, thereby altering its capacity to provide colonization resistance and consecutive pathobiont overgrowth and infections. Therefore, we longitudinally studied the impact of mode of delivery on the nasopharyngeal microbiota development from birth until six months of age in a healthy, unselected birth cohort of 102 children (n=761 samples). Here, we show that the respiratory microbiota develops within one day from a variable mixed bacterial community towards a Streptococcus viridans-predominated profile, regardless of mode of delivery. Within the first week, rapid niche differentiation had occurred; initially with in most infants Staphylococcus aureus predominance, followed by differentiation towards Corynebacterium pseudodiphteriticum/propinquum, Dolosigranulum pigrum, Moraxella catarrhalis/nonliquefaciens, Streptococcus pneumoniae, and/or Haemophilus influenzae dominated communities. Infants born by Caesarian section showed a delay in overall development of respiratory microbiota profiles with specifically reduced colonization with health-associated commensals like Corynebacterium and Dolosigranulum, thereby possibly influencing respiratory health later in life.

Keywords: Caesarian section; Microbiome; Microbiota; Mode of delivery; Respiratory tract; Respiratory tract infection.


Figures

Fig. 1
Fig. 1
Microbial profiles from birth till 6 months of age. (a) Origin of samples collected postpartum. Genera present in the samples collected postpartum (n = 16) were coloured based on the presumed niches of origin (as known in literature), i.e. intestinal (blue), vaginal (purple), airways or oral (orange), skin or environmental sources (green) and unknown (grey). Samples were divided by the mode of delivery. (b) Relative abundances of the 15 most abundant oligotypes are depicted for all samples per sampling moment. (c) Relative abundance of the 15 most abundant oligotypes for either children born by C-section (left) or vaginal birth (right) per sampling moment. Abbreviation: CS = C-section born children, Vag = vaginally born children. (For interpretation of the references to color in this figure legend, the reader is referred to the web version of this article.)
Fig. 2
Fig. 2
Microbial succession patterns during the first six months of life. In order to gain more insight into microbial succession patterns, we tracked the children over time to follow their time path from one cluster at a certain time point to the same or another cluster at the consecutive time point. (a) Heatmap showing per time point the percentile of children that belonged to each of the 11 clusters found. (b) and (c) Graphic representation of the flow of children between clusters over time. By using co-regularized spectral clustering, we obtained per cluster a probabilistic likelihood (between zero and one) that a child belonged to this cluster. The higher the probability score, the higher the assignment of a child to a cluster. By depicting this for every child per time point, we were able to track cluster switching over time. The bars depict the clusters per time point (e.g. postpartum, day one), and the size of the bar represents the number of children belonging to that cluster. The surface between one cluster at a certain time point and the adjacent time point indicate the movements of children from that cluster to another. Panel b shows the movement of children over time when using a cut-off of the probabilistic score of 0.5. In panel c the cut-off of 0.8 is used and additionally the mode of delivery is depicted (pink surface between clusters = vaginally born children, blue = C-section born children). Children that did not meet a value above the cut-off were put in the intermediate cluster (in panel b) or for convenience were left out of the figure (in panel c). Please note that since two adjacent time points fulfilling the criteria with a likelihood of > 0.5 (b) or > 0.8 (c) were required to track the switching between clusters, some cluster have a mismatch between “input”(left surface, going into a bar) and “output” (right side going to the next bars). Abbreviations; Staph, Staphylococcus; Jant, Janthinobacterium; Strep, Streptococcus viridans; ML, Moraxella lincolnii; Cor, Corynebacterium; Dolo, Dolosigranulum; Mor, Moraxella; HI, Haemophilus influenzae; INT, Intermediate cluster (children with a probabilistic likelihood < 0.5). (For interpretation of the references to color in this figure legend, the reader is referred to the web version of this article.)
Fig. 3
Fig. 3
Magnitude of relative change of the microbial profiles during the first six months of life. The L2 norm value is depicted for the change between the samples at age one week and two months (pink), two and four months (yellow) and four and six months of age (blue), respectively. A higher norm value indicates a higher magnitude of change between the time points. The children were sorted from a lower magnitude of change (left) to a higher magnitude of total change (right). Although there are inter-individual differences in change over time, the highest magnitude of change occurred in general during the first two months of life, followed by the two-four months of age time frame and the four-six months of age time frame (p < 0.01 and p < 0.0001 respectively as compared to week one-two months of age). (For interpretation of the references to color in this figure legend, the reader is referred to the web version of this article.)
Fig. 4
Fig. 4
Time course analyses of biomarker species. Time-course behavior of (a) S. aureus, (b) C. pseudodiphteriticum/propinquum, (c) D. pigrum, (d) S. viridans, (e) Gemella sp., (f) S. salivarius based on mode of delivery in the overall cohort (panel a). Time-course behavior of (a) S. aureus and (b) D. pigrum in a subset of children comparing exclusively breastfed with exclusively formula-fed children (respectively n = 19 and n = 28 children) (panel b).

References

    1. Beck J.M., Young V.B., Huffnagle G.B. The microbiome of the lung. Transl. Res. 2012;160:258–266. - PMC - PubMed
    1. Biesbroek G., Sanders E.A.M., Roeselers G., Wang X., Caspers M.P.M., Trzciński K., Bogaert D., Keijser B.J.F. Deep sequencing analyses of low density microbial communities: working at the boundary of accurate microbiota detection. PLoS One. 2012;7 - PMC - PubMed
    1. Biesbroek G., Bosch A.A.T.M., Wang X., Keijser B.J.F., Veenhoven R.H., Sanders E.A.M., Bogaert D. The impact of breastfeeding on nasopharyngeal microbial communities in infants. Am. J. Respir. Crit. Care Med. 2014;190:298–308. - PubMed
    1. Biesbroek G., Tsivtsivadze E., Sanders E.A.M., Montijn R., Veenhoven R.H., Keijser B.J.F., Bogaert D. Early respiratory microbiota composition determines bacterial succession patterns and respiratory health in children. Am. J. Respir. Crit. Care Med. 2014 - PubMed
    1. Bosch A.A.T.M., van Houten M.A., Bruin J.P., Wijmenga-Monsuur A.J., Trzciński K., Bogaert D., Rots N.Y., Sanders E.A.M. Nasopharyngeal carriage of Streptococcus pneumoniae and other bacteria in the 7th year after implementation of the pneumococcal conjugate vaccine in the Netherlands. Vaccine. 2015;34:531–539. - PubMed

Publication types