

Detecting Anatomical Landmarks for Fast Alzheimer's Disease Diagnosis
- PMID: 27333602
- PMCID: PMC5153382
- DOI: 10.1109/TMI.2016.2582386
Detecting Anatomical Landmarks for Fast Alzheimer's Disease Diagnosis
Abstract
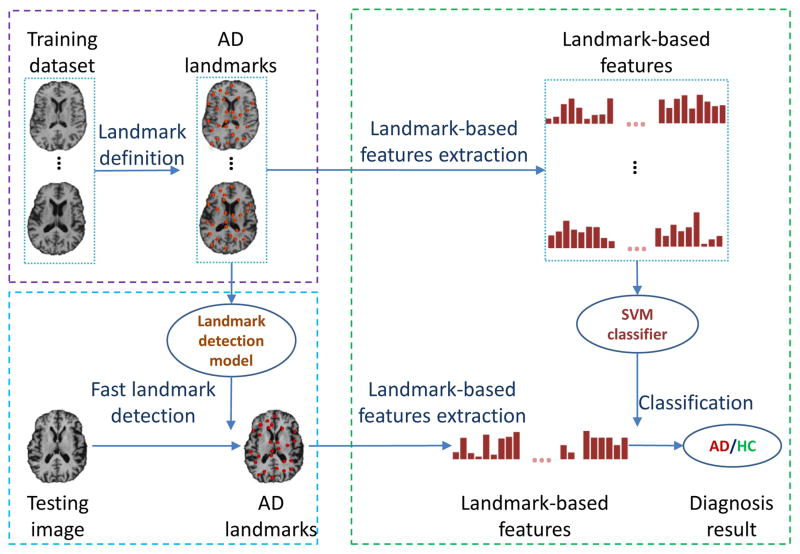
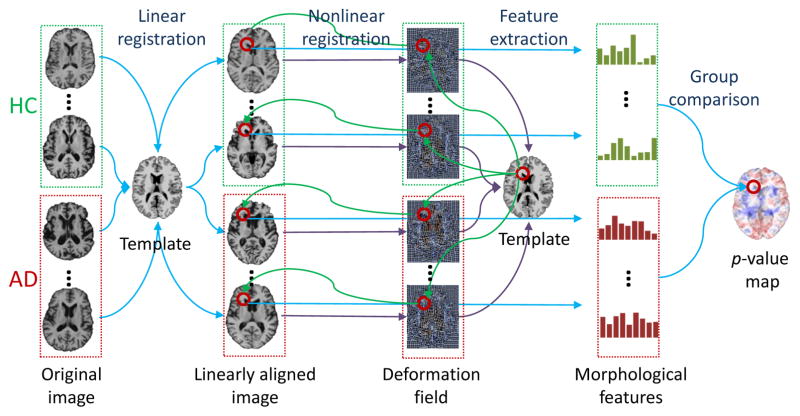
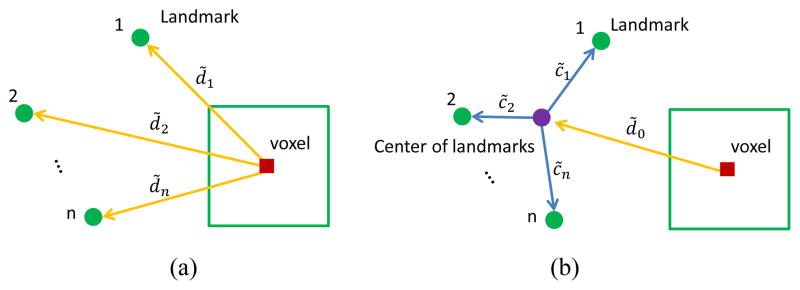
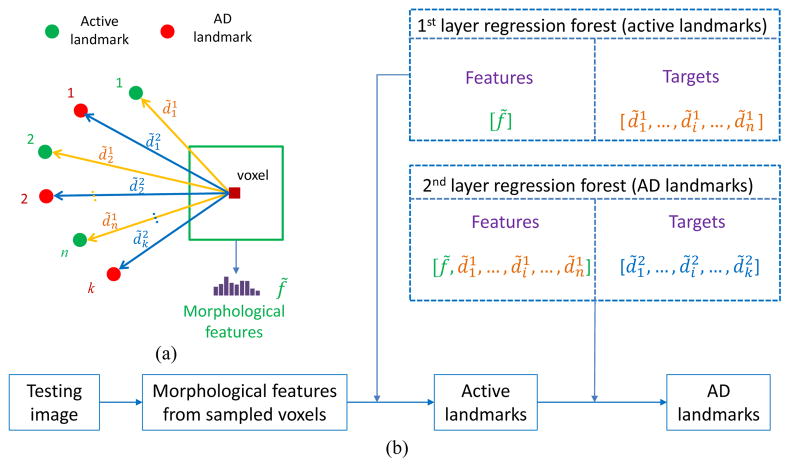
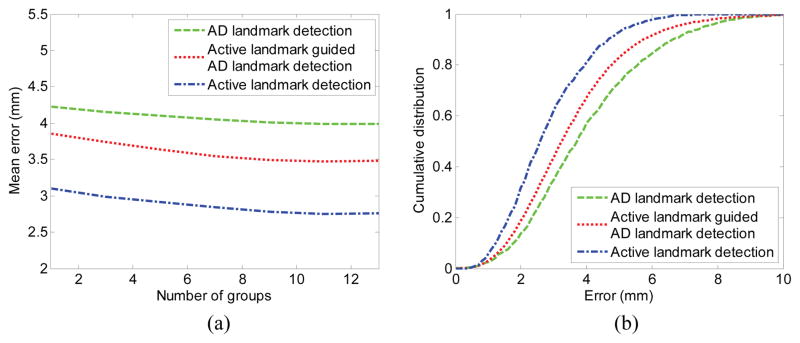
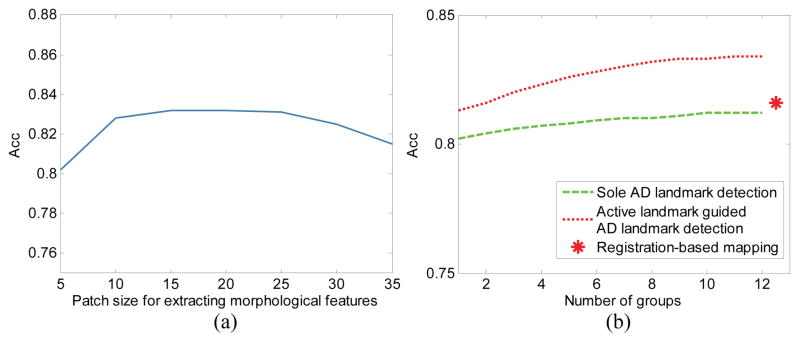
Structural magnetic resonance imaging (MRI) is a very popular and effective technique used to diagnose Alzheimer's disease (AD). The success of computer-aided diagnosis methods using structural MRI data is largely dependent on the two time-consuming steps: 1) nonlinear registration across subjects, and 2) brain tissue segmentation. To overcome this limitation, we propose a landmark-based feature extraction method that does not require nonlinear registration and tissue segmentation. In the training stage, in order to distinguish AD subjects from healthy controls (HCs), group comparisons, based on local morphological features, are first performed to identify brain regions that have significant group differences. In general, the centers of the identified regions become landmark locations (or AD landmarks for short) capable of differentiating AD subjects from HCs. In the testing stage, using the learned AD landmarks, the corresponding landmarks are detected in a testing image using an efficient technique based on a shape-constrained regression-forest algorithm. To improve detection accuracy, an additional set of salient and consistent landmarks are also identified to guide the AD landmark detection. Based on the identified AD landmarks, morphological features are extracted to train a support vector machine (SVM) classifier that is capable of predicting the AD condition. In the experiments, our method is evaluated on landmark detection and AD classification sequentially. Specifically, the landmark detection error (manually annotated versus automatically detected) of the proposed landmark detector is 2.41 mm , and our landmark-based AD classification accuracy is 83.7%. Lastly, the AD classification performance of our method is comparable to, or even better than, that achieved by existing region-based and voxel-based methods, while the proposed method is approximately 50 times faster.
Figures
Similar articles
-
Alzheimer's Disease Diagnosis Using Landmark-Based Features From Longitudinal Structural MR Images.IEEE J Biomed Health Inform. 2017 Nov;21(6):1607-1616. doi: 10.1109/JBHI.2017.2704614. Epub 2017 May 16. IEEE J Biomed Health Inform. 2017. PMID: 28534798 Free PMC article.
-
Robust anatomical landmark detection with application to MR brain image registration.Comput Med Imaging Graph. 2015 Dec;46 Pt 3(0 3):277-90. doi: 10.1016/j.compmedimag.2015.09.002. Epub 2015 Sep 25. Comput Med Imaging Graph. 2015. PMID: 26433614 Free PMC article.
-
Joint Classification and Regression via Deep Multi-Task Multi-Channel Learning for Alzheimer's Disease Diagnosis.IEEE Trans Biomed Eng. 2019 May;66(5):1195-1206. doi: 10.1109/TBME.2018.2869989. Epub 2018 Sep 12. IEEE Trans Biomed Eng. 2019. PMID: 30222548 Free PMC article.
-
Robust automated constellation-based landmark detection in human brain imaging.Neuroimage. 2018 Apr 15;170:471-481. doi: 10.1016/j.neuroimage.2017.04.012. Epub 2017 Apr 6. Neuroimage. 2018. PMID: 28392490 Free PMC article. Review.
-
Reproducible Evaluation of Diffusion MRI Features for Automatic Classification of Patients with Alzheimer's Disease.Neuroinformatics. 2021 Jan;19(1):57-78. doi: 10.1007/s12021-020-09469-5. Neuroinformatics. 2021. PMID: 32524428
Cited by
-
Generative adversarial network constrained multiple loss autoencoder: A deep learning-based individual atrophy detection for Alzheimer's disease and mild cognitive impairment.Hum Brain Mapp. 2023 Feb 15;44(3):1129-1146. doi: 10.1002/hbm.26146. Epub 2022 Nov 17. Hum Brain Mapp. 2023. PMID: 36394351 Free PMC article.
-
Deep Multi-Task Multi-Channel Learning for Joint Classification and Regression of Brain Status.Med Image Comput Comput Assist Interv. 2017 Sep;10435:3-11. doi: 10.1007/978-3-319-66179-7_1. Epub 2017 Sep 4. Med Image Comput Comput Assist Interv. 2017. PMID: 29756129 Free PMC article.
-
Landmark-based deep multi-instance learning for brain disease diagnosis.Med Image Anal. 2018 Jan;43:157-168. doi: 10.1016/j.media.2017.10.005. Epub 2017 Oct 27. Med Image Anal. 2018. PMID: 29107865 Free PMC article.
-
Weakly Supervised Deep Learning for Brain Disease Prognosis Using MRI and Incomplete Clinical Scores.IEEE Trans Cybern. 2020 Jul;50(7):3381-3392. doi: 10.1109/TCYB.2019.2904186. Epub 2019 Mar 26. IEEE Trans Cybern. 2020. PMID: 30932861 Free PMC article.
-
An ensemble learning system for a 4-way classification of Alzheimer's disease and mild cognitive impairment.J Neurosci Methods. 2018 May 15;302:75-81. doi: 10.1016/j.jneumeth.2018.03.008. Epub 2018 Mar 22. J Neurosci Methods. 2018. PMID: 29578038 Free PMC article.
References
-
- Rice DP, Fox PJ, Max W, Webber PA, Lindeman DA, Hauck WW, Segura E. The economic burden of Alzheimer’s disease care. Health Affairs. 1993;12(2):164–176. - PubMed
-
- Maresova P, Mohelska H, Dolejs J, Kuca K. Socio-economic aspects of Alzheimer’s disease. Current Alzheimer Research. 2015;12(9):903–911. - PubMed
-
- Sperling RA, Aisen PS, Beckett LA, Bennett DA, Craft S, Fagan AM, Iwatsubo T, Jack CR, Kaye J, Montine TJ, et al. Toward defining the preclinical stages of Alzheimer’s disease: Recommendations from the national institute on aging-Alzheimer’s association workgroups on diagnostic guidelines for Alzheimer’s disease. Alzheimer’s & Dementia. 2011;7(3):280–292. - PMC - PubMed
-
- Blennow K, de Leon MJ, Zetterberg H. Alzheimer’s disease. Lancet. 2006;368(9533):387–403. - PubMed
Publication types
MeSH terms
Grants and funding
LinkOut - more resources
Full Text Sources
Other Literature Sources
Medical
