. 2016 Jun 23:6:28299.
doi: 10.1038/srep28299.

TCF7L1 Modulates Colorectal Cancer Growth by Inhibiting Expression of the Tumor-Suppressor Gene EPHB3

Affiliations

TCF7L1 Modulates Colorectal Cancer Growth by Inhibiting Expression of the Tumor-Suppressor Gene EPHB3

Matthew Murphy et al. Sci Rep. .

Abstract

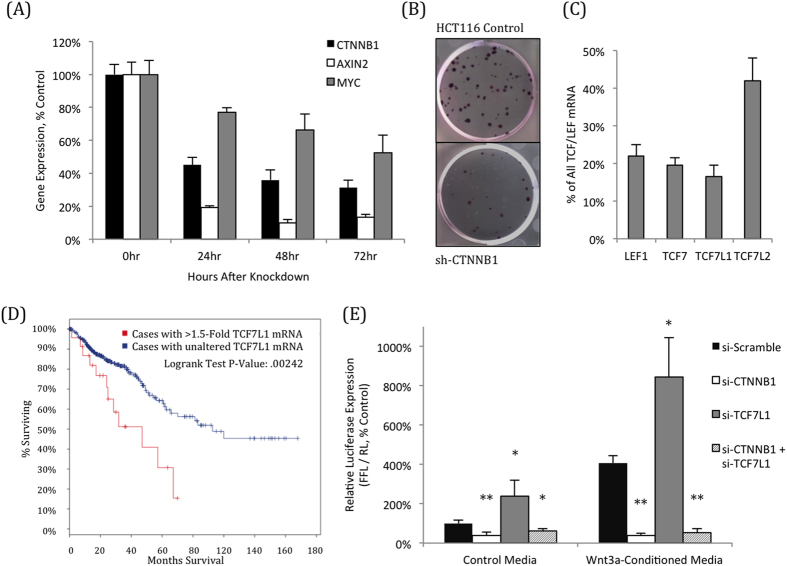
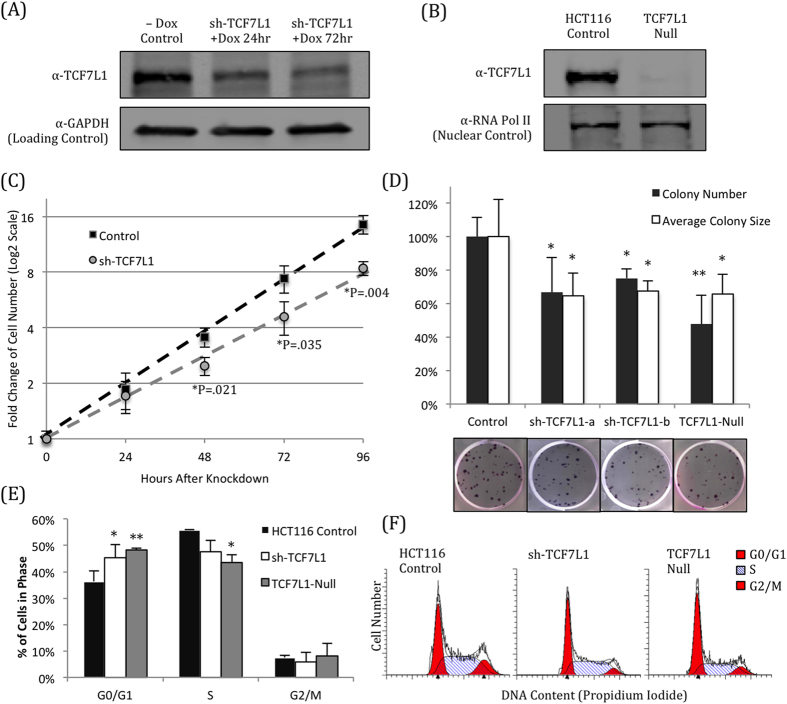
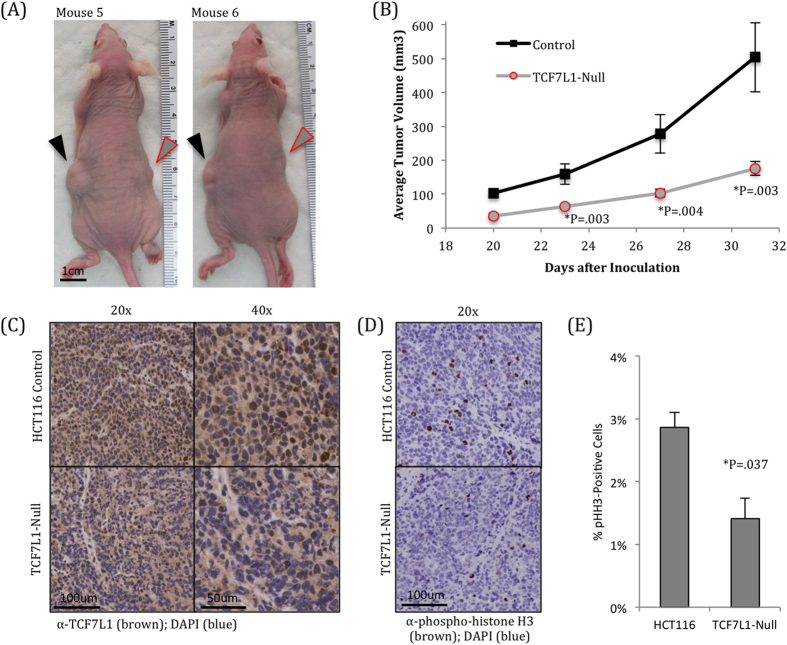
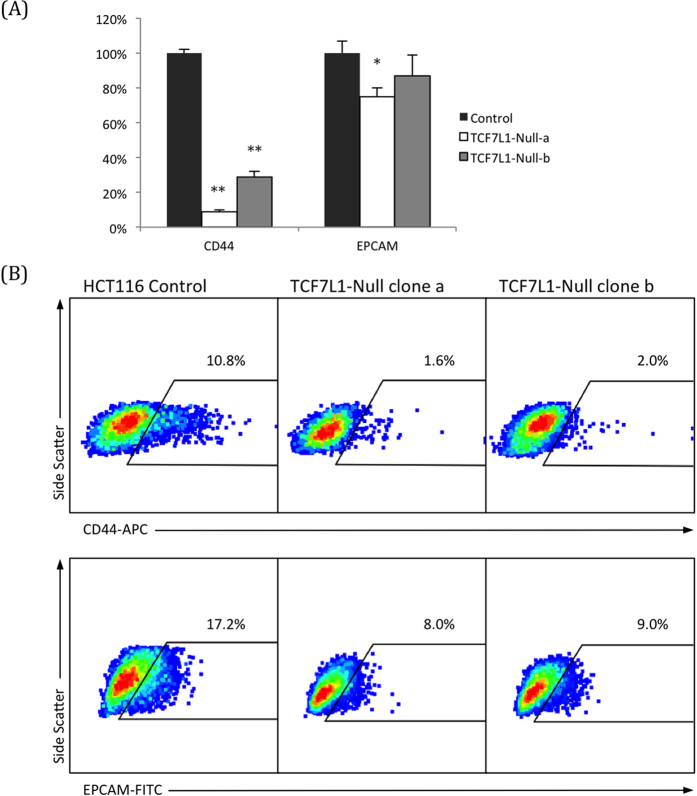
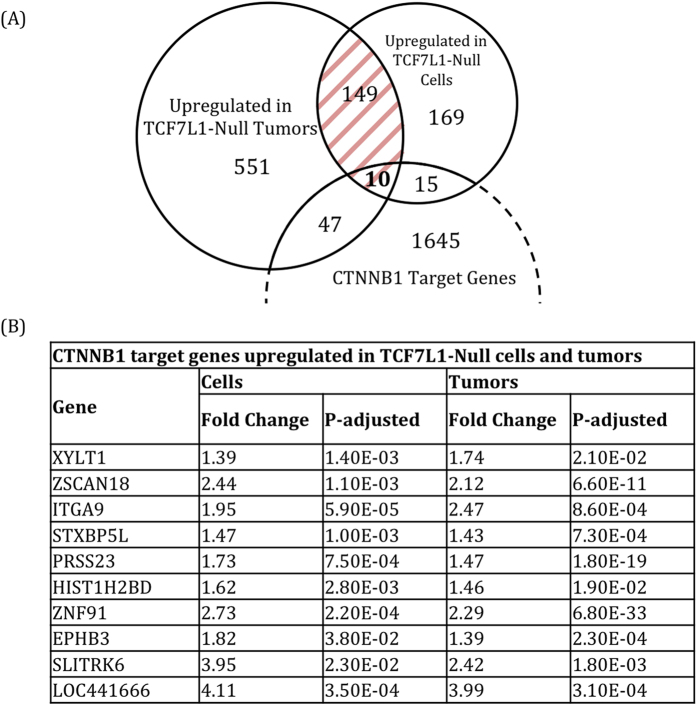
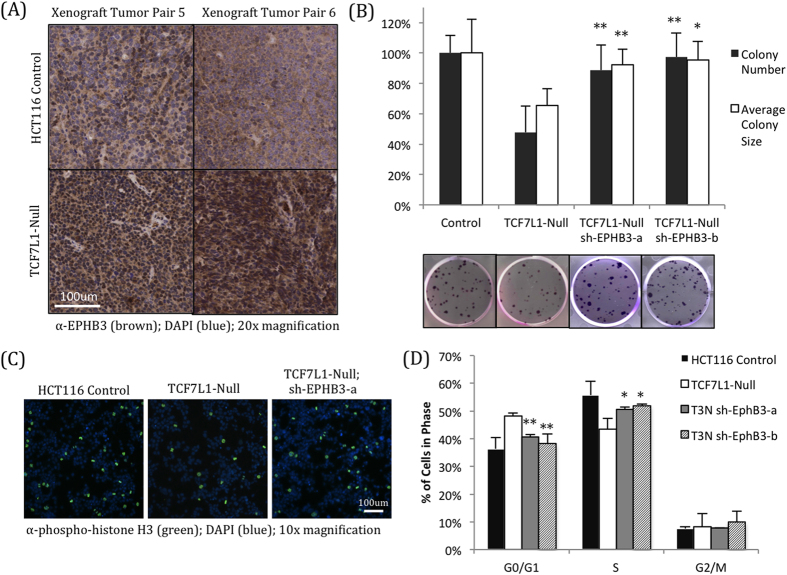
Dysregulation of the Wnt pathway leading to accumulation of β-catenin (CTNNB1) is a hallmark of colorectal cancer (CRC). Nuclear CTNNB1 acts as a transcriptional coactivator with TCF/LEF transcription factors, promoting expression of a broad set of target genes, some of which promote tumor growth. However, it remains poorly understood how CTNNB1 interacts with different transcription factors in different contexts to promote different outcomes. While some CTNNB1 target genes are oncogenic, others regulate differentiation. Here, we found that TCF7L1, a Wnt pathway repressor, buffers CTNNB1/TCF target gene expression to promote CRC growth. Loss of TCF7L1 impaired growth and colony formation of HCT116 CRC cells and reduced tumor growth in a mouse xenograft model. We identified a group of CTNNB1/TCF target genes that are activated in the absence of TCF7L1, including EPHB3, a marker of Paneth cell differentiation that has also been implicated as a tumor suppressor in CRC. Knockdown of EPHB3 partially restores growth and normal cell cycle progression of TCF7L1-Null cells. These findings suggest that while CTNNB1 accumulation is critical for CRC progression, activation of specific Wnt target genes in certain contexts may in fact inhibit tumor growth.


Figures

Figure 1
Figure 1. TCF7L1 represses Wnt-dependent transcription in HCT116 cells.
(A) Knockdown of CTNNB1 reduces expression of AXIN2 and MYC, two Wnt pathway target genes that are direct targets of CTNNB1/TCF. (B) Knockdown of CTNNB1 causes a massive reduction in HCT116 growth and colony formation. (C) HCT116 cells express all four TCF/LEF transcription factors, shown by qPCR as a percentage of the total combined TCF/LEF mRNA. (D) CRC patients whose tumors had elevated TCF7L1 mRNA levels (at least 1.5-fold above average) had a significantly shorter survival (47 months) than those with normal TCF7L1 expression (93 months). Patient data utilized was from the TCGA provisional colorectal adenocarcinoma database, accessed via cbioportal.org. (E) Knockdown CTNNB1 reduces expression TOPFlash, a Wnt pathway transcriptional reporter. Conversely, knockdown of TCF7L1 activates reporter expression, confirming its role as a transcriptional repressor in HCT116 cells, even in the presence of exogenous Wnt3a. Activation by TCF7L1 knockdown and Wnt3a addition were both dependent on CTNNB1 expression. (*P < 0.05, **P < 0.01, compared to si-Scramble for the respective media condition).
Figure 2
Figure 2. Loss of TCF7L1 reduces HCT116 cell growth and proliferation.
(A) shRNA-mediated knockdown of TCF7L1 reduces protein expression within 24 hours of induction by addition of doxycycline (Dox). (B) CRISPR/Cas9 was used to completely eliminate TCF7L1 protein expression, without inhibiting expression of other TCF/LEF factors (Supplementary Fig. S2). (C) TCF7L1 knockdown significantly slowed the growth of HCT116 cells within 48 hours of shRNA induction. (D) HCT116 cells with reduced (sh-TCF7L1) or eliminated (TCF7L1-Null) expression of TCF7L1 had significantly reduced colony growth (*P < 0.05, **P < 0.01, compared to Control). These cells formed fewer colonies with a smaller average colony size. Representative images are shown below quantification. Average and standard deviation were calculated across three independent experiments with at least three replicates each. (E) Loss of TCF7L1 affected cell cycle progression, causing a significant increase in G0/G1-phase cells, with a concomitant reduction in S-phase. (*P < 0.05; **P < 0.01 compared to HCT116 control for the respective cell cycle phase.) (F) Representative cell cycle images generated with ModFit.
Figure 3
Figure 3. TCF7L1-Null cells have significantly reduced tumor growth.
(A) 10,000 HCT116 control and TCF7L1-Null cells were inoculated subcutaneously into opposite flanks of mice and measured over 31 days once tumors became visible. Representative mice are shown 31 days after inoculation. Control tumors on the left flank (black arrowhead) are visibly larger than TCF7L1-Null tumors on the right flank (gray arrowhead with red border). (B) Quantification of xenograft tumor sizes shows that TCF7L1-Null tumors were significantly smaller than control tumors. Data are tumor volume mean ± SEM, n = 25. (C) Immunohistochemistry for TCF7L1 shows visible nuclear staining in control tumors (top), which is largely absent in TCF7L1-Null tumors from the same mice (bottom). Shown at 20x (left) and 40x (right) magnifications. (D) Immunohistochemistry for phosphorylated histone H3, a marker of actively dividing cells, shows fewer dividing cells in TCF7L1-Null tumors. (E) Quantification of pHH3 staining, average and standard deviation were calculated from three tumor pairs.
Figure 4
Figure 4. Expression of cancer stem cell markers is reduced in TCF7L1-Null cells.
(A) qPCR confirmed that expression of CD44, a putative cancer stem cell (CSC) marker, was almost completely eliminated in TCF7L1-Null cells. Another CSC marker, EPCAM, had a modest reduction in TCF7L1-Null cells. (B) Flow cytometry with an APC-conjugated CD44 antibody revealed that TCF7L1-Null cells had significantly fewer CD44 + cells than control cells. (P < 0.01 for both clones, average was taken across three experiments.) FITC-conjugated EPCAM followed a similar trend, but with a less dramatic reduction in expression (P < 0.05 for both clones, average was taken across three experiments).
Figure 5
Figure 5. RNA-sequencing analysis reveals candidate TCF7L1 target genes.
(A) Venn diagram showing genes significantly upregulated in TCF7L1-Null tumors and/or cells. The 757 genes upregulated in TCF7L1-Null tumors are shown in Supplementary Table S2. The 159 overlapping genes (shaded in red) are shown in the heat map in Supplementary Fig. S4. We identified ten genes from this group that have been previously described as direct targets of CTNNB1. (B) Table showing the ten CTNNB1 target genes that were significantly upregulated in TCF7L1-Null cells and tumors.
Figure 6
Figure 6. Knockdown of EPHB3 rescues growth of TCF7L1-Null cells.
(A) Immunohistochemistry for EPHB3 shows elevated expression in TCF7L1-Null xenograft tumors (bottom) compared to control tumors from the same mice (top), reflecting the significant mRNA upregulation observed by RNA-sequencing and qPCR. (B) EPHB3 knockdown largely rescued colony formation of TCF7L1-Null cells. Colony number and average colony size was significantly higher than that of TCF7L1-Null cells, and almost returned to the levels of control cells (*P < 0.05, **P < 0.01, compared to TCF7L1-Null). Representative images are shown below quantification. Average and standard deviation were calculated across three independent experiments with at least three replicates each. (C) Immunofluorescence for phosphorylated histone H3 revealed that EPHB3 knockdown in TCF7L1-Null cells restores the percentage of actively divided cells near levels observed in control cells (quantified in Supplementary Fig. S6). (D) EPHB3 knockdown partially rescues the stalled cell cycle progression seen in TCF7L1-Null cells, with a significant reduction in G0/G1-phase cells and a corresponding increase in S-phase cells. (*P < 0.05, *P < 0.01, compared to TCF7L1-Null cells of respective cell cycle phase). Representative images shown in Supplementary Fig. S5.

Similar articles

Cited by

References

    1. Cadigan K. M. & Nusse R. Wnt signaling: a common theme in animal development. Genes Dev 11, 3286–3305 (1997). - PubMed
    1. Moon R. T., Brown J. D. & Torres M. WNTs modulate cell fate and behavior during vertebrate development. Trends Genet 13, 157–162 (1997). - PubMed
    1. Gregorieff A. et al.. Expression pattern of Wnt signaling components in the adult intestine. Gastroenterology 129, 626–638, 10.1016/j.gastro.2005.06.007 (2005). - DOI - PubMed
    1. Yang J. et al.. Adenomatous polyposis coli (APC) differentially regulates beta-catenin phosphorylation and ubiquitination in colon cancer cells. J Biol Chem 281, 17751–17757, 10.1074/jbc.M600831200 (2006). - DOI - PubMed
    1. The Cancer Genome Atlas Network. Comprehensive molecular characterization of human colon and rectal cancer. Nature 487, 330–337, 10.1038/nature11252 (2012). - DOI - PMC - PubMed

Publication types

MeSH terms