

Hydration Repulsion between Carbohydrate Surfaces Mediated by Temperature and Specific Ions
- PMID: 27334145
- PMCID: PMC4917866
- DOI: 10.1038/srep28553
Hydration Repulsion between Carbohydrate Surfaces Mediated by Temperature and Specific Ions
Abstract
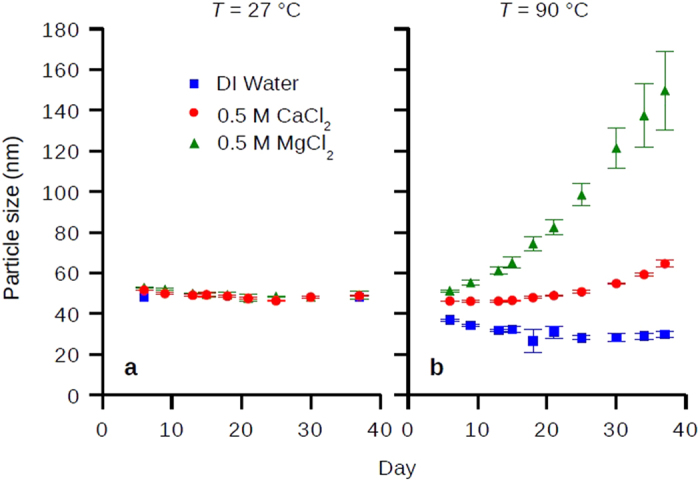
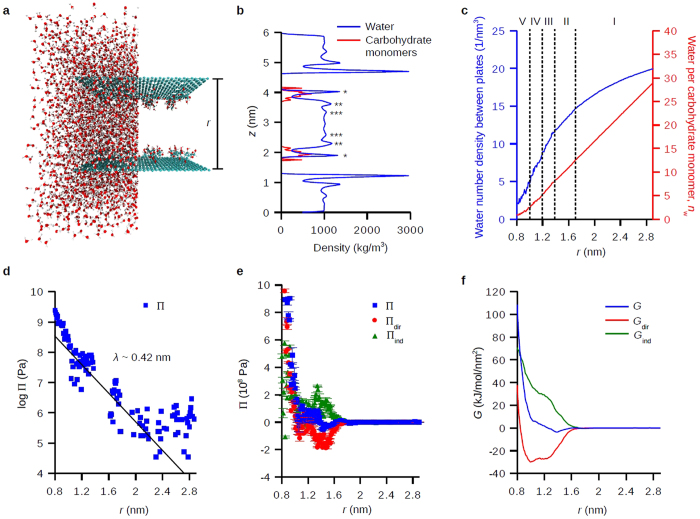
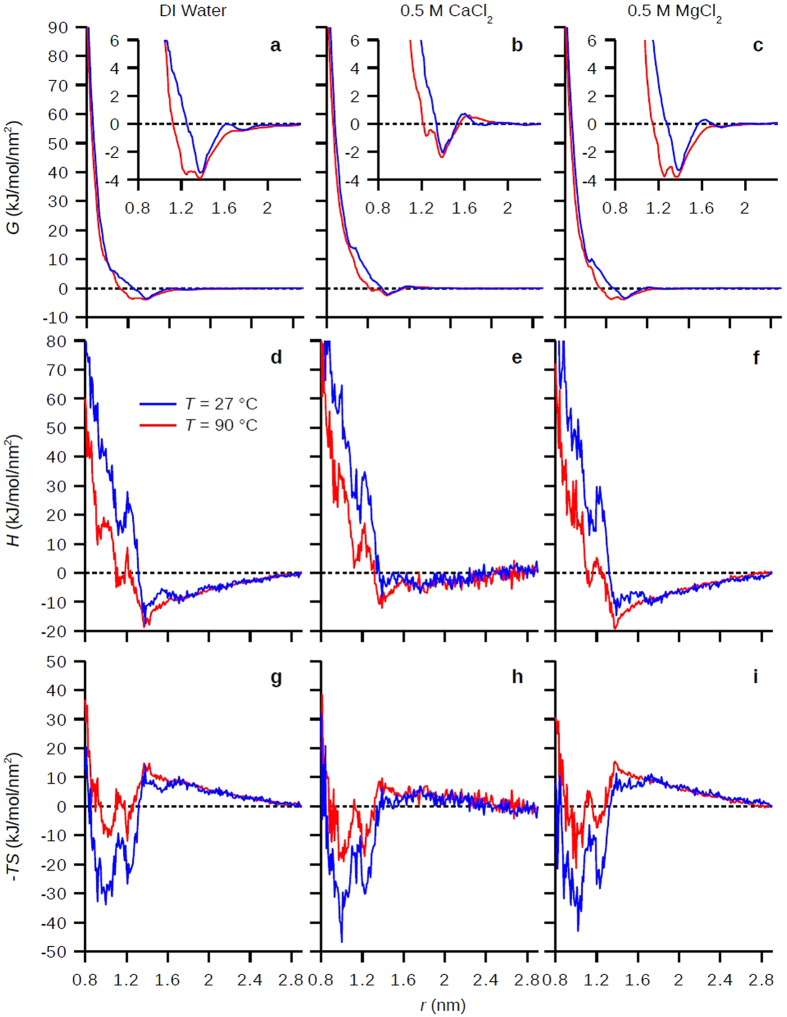
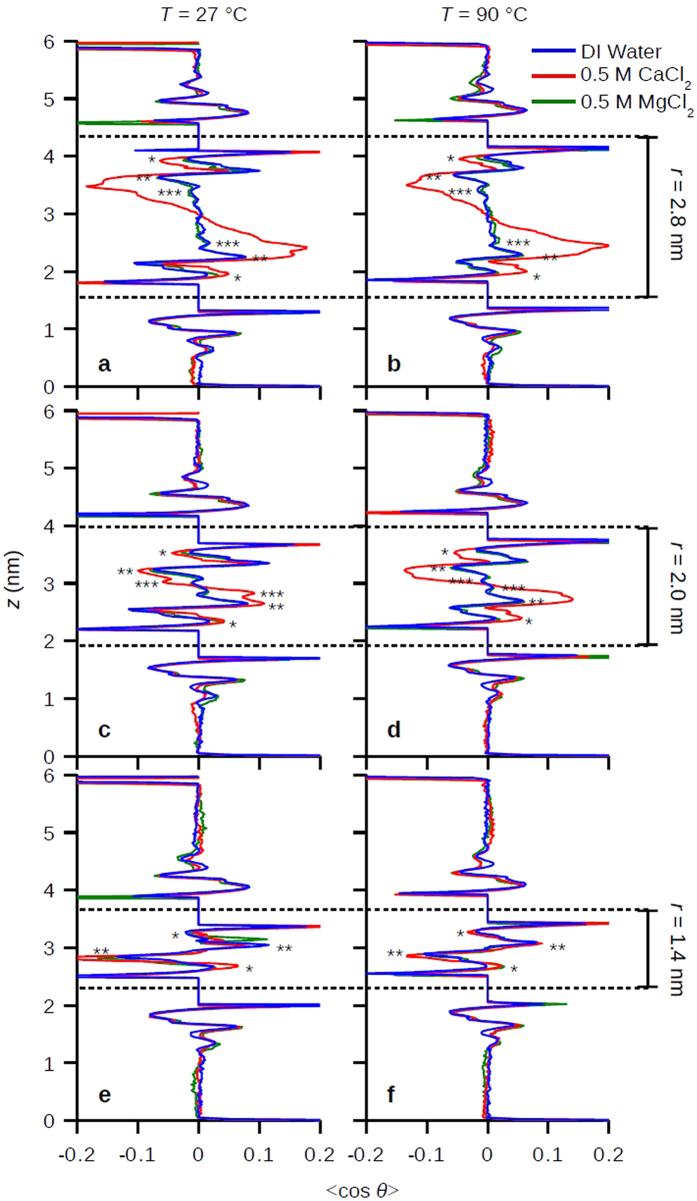
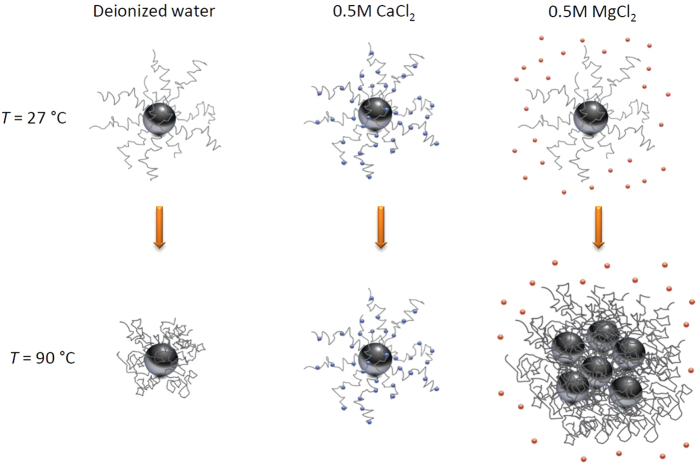
Stabilizing colloids or nanoparticles in solution involves a fine balance between surface charges, steric repulsion of coating molecules, and hydration forces against van der Waals attractions. At high temperature and electrolyte concentrations, the colloidal stability of suspensions usually decreases rapidly. Here, we report a new experimental and simulation discovery that the polysaccharide (dextran) coated nanoparticles show ion-specific colloidal stability at high temperature, where we observed enhanced colloidal stability of nanoparticles in CaCl2 solution but rapid nanoparticle-nanoparticle aggregation in MgCl2 solution. The microscopic mechanism was unveiled in atomistic simulations. The presence of surface bound Ca(2+) ions increases the carbohydrate hydration and induces strongly polarized repulsive water structures beyond at least three hydration shells which is farther-reaching than previously assumed. We believe leveraging the binding of strongly hydrated ions to macromolecular surfaces represents a new paradigm in achieving absolute hydration and colloidal stability for a variety of materials, particularly under extreme conditions.
Figures
Similar articles
-
Ion-binding of glycine zwitterion with inorganic ions in biologically relevant aqueous electrolyte solutions.Biophys Chem. 2014 Jun;190-191:25-31. doi: 10.1016/j.bpc.2014.04.001. Epub 2014 Apr 15. Biophys Chem. 2014. PMID: 24780753
-
Specific ion effects via ion hydration: II. Double layer interaction.Adv Colloid Interface Sci. 2003 Sep 18;105:177-200. doi: 10.1016/s0001-8686(03)00068-x. Adv Colloid Interface Sci. 2003. PMID: 12969645
-
Effects of molecular weight-dependent physicochemical heterogeneity of natural organic matter on the aggregation of fullerene nanoparticles in mono- and di-valent electrolyte solutions.Water Res. 2015 Mar 15;71:11-20. doi: 10.1016/j.watres.2014.12.025. Epub 2015 Jan 5. Water Res. 2015. PMID: 25577691
-
Monopolar surfaces.Adv Colloid Interface Sci. 1987 Nov;28(1):35-64. doi: 10.1016/0001-8686(87)80008-8. Adv Colloid Interface Sci. 1987. PMID: 3333137 Review.
-
The polarization model for hydration/double layer interactions: the role of the electrolyte ions.Adv Colloid Interface Sci. 2004 Dec 31;112(1-3):109-28. doi: 10.1016/j.cis.2004.09.001. Adv Colloid Interface Sci. 2004. PMID: 15581557 Review.
Cited by
-
Controlling water-mediated interactions by designing self-assembled monolayer coatings.Sci Rep. 2021 Apr 19;11(1):8459. doi: 10.1038/s41598-021-87708-8. Sci Rep. 2021. PMID: 33875723 Free PMC article.
-
The physics of cement cohesion.Sci Adv. 2021 Aug 4;7(32):eabg5882. doi: 10.1126/sciadv.abg5882. Print 2021 Aug. Sci Adv. 2021. PMID: 34348896 Free PMC article.
-
Calcium-Mediated Adhesion of Nanomaterials in Reservoir Fluids.Sci Rep. 2017 Sep 14;7(1):11613. doi: 10.1038/s41598-017-11816-7. Sci Rep. 2017. PMID: 28912550 Free PMC article.
-
High-temperature high-pressure microfluidic system for rapid screening of supercritical CO2 foaming agents.Sci Rep. 2021 Feb 9;11(1):3360. doi: 10.1038/s41598-021-82839-4. Sci Rep. 2021. PMID: 33564048 Free PMC article.
-
Understanding Calcium-Mediated Adhesion of Nanomaterials in Reservoir Fluids by Insights from Molecular Dynamics Simulations.Sci Rep. 2019 Jul 24;9(1):10763. doi: 10.1038/s41598-019-46999-8. Sci Rep. 2019. PMID: 31341192 Free PMC article.
References
-
- Israelachvili J. & Wennerstrom H. Role of hydration and water structure in biological and colloidal interactions. Nature 379, 219–225 (1996). - PubMed
-
- Otting G., Liepinsh E. & Wuthrich K. Protein hydration in aqueous solution. Science 254, 974–980 (1991). - PubMed
-
- Zaks A. & Klibanov A. M. The effect of water on enzyme action in organic media. J. Biol. Chem. 263, 8017–8021 (1988). - PubMed
-
- Raviv U. & Klein J. Fluidity of bound hydration layers. Science 297, 1540–1543 (2002). - PubMed
-
- LeNeveu D. & Rand R. P. Measurement of forces between lecithin bilayers. Nature 259, 601–603 (1976). - PubMed
MeSH terms
Substances
LinkOut - more resources
Full Text Sources
Other Literature Sources
Miscellaneous
