

doi: 10.1136/bmj.i3139.
The spectrum effect in tests for risk prediction, screening, and diagnosis
Affiliations
- PMID: 27334281
- PMCID: PMC4916916
- DOI: 10.1136/bmj.i3139
Item in Clipboard
The spectrum effect in tests for risk prediction, screening, and diagnosis
BMJ.
.
Abstract
The spectrum effect describes the variation between settings in performance of tests used to predict, screen for, and diagnose disease. In particular, the predictive use of a test may be different when it is applied in a general population rather than in the study sample in which it was first developed. This article discusses the impact of the spectrum effect on measures of test performance, and its implications for the development, evaluation, application, and implementation of such tests.
Conflict of interest statement
Competing interests: None declared.
Figures
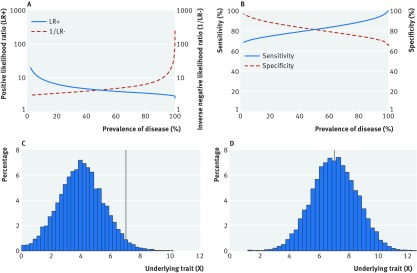
Fig 1 Scenario 1. Variation in (A) positive likelihood ratio (blue solid line) and inverse of negative likelihood ratio (red dashed line), and (B) sensitivity (blue solid line) and specificity (red dashed line) with true prevalence of a disease where true prevalence of disease is changed by varying the mean of a normal distribution of a continuous variable X while keeping the threshold value constant (C and D). True disease is defined as present if X≥7, and absent if X<7. Disease prevalence, for illustration, is (C) 2.3%, (D) 49.6%. As prevalence decreases, the positive likelihood ratio (LR+), negative likelihood ratio (LR−), and specificity increase, while sensitivity decreases, with 10-fold changes in likelihood ratios and variation of 30% in sensitivity and specificity. Values for all plots obtained via simulation as described in the supplementary appendix (scenario 1)
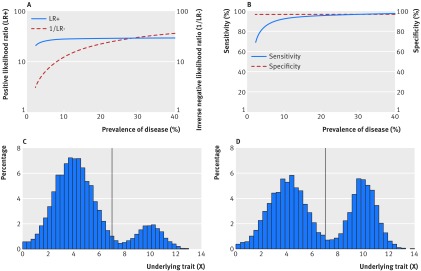
Fig 2 Scenario 2. Variation in (A) positive likelihood ratio (blue solid line) and inverse of negative likelihood ratio (red dashed line), and (B) sensitivity (blue solid line) and specificity (red dashed line) with true prevalence of a disease where true prevalence of disease is changed by altering the distribution of a bimodal distribution of a continuous variable X while keeping the threshold value constant (C and D). True disease is defined as present if X≥7, and absent if X<7. Disease prevalence, for illustration, is: (C) 17.1%, (D) 41.1%. As prevalence increases, the risk of test misclassification among people with the disease decreases and—with this particular underlying distribution of X—results in an increase in sensitivity and decrease in the negative likelihood ratio. Values for all plots obtained via simulation as described in the supplementary appendix (scenario 2)
References
-
- Diamond GA. Reverend Bayes’ silent majority. An alternative factor affecting sensitivity and specificity of exercise electrocardiography. Am J Cardiol 1986;57:1175-80. 10.1016/0002-9149(86)90694-6 pmid:3754686. - DOI - PubMed
-
- Irwig L, Bossuyt P, Glasziou P, Gatsonis C, Lijmer J. Designing studies to ensure that estimates of test accuracy are transferable. BMJ 2002;324:669-71. 10.1136/bmj.324.7338.669 pmid:11895830. - DOI - PMC - PubMed
-
- Leeflang MMG, Bossuyt PMM, Irwig L. Diagnostic test accuracy may vary with prevalence: implications for evidence-based diagnosis. J Clin Epidemiol 2009;62:5-12. 10.1016/j.jclinepi.2008.04.007 pmid:18778913. - DOI - PubMed
-
- Moons KG, van Es GA, Deckers JW, Habbema JD, Grobbee DE. Limitations of sensitivity, specificity, likelihood ratio, and bayes’ theorem in assessing diagnostic probabilities: a clinical example. Epidemiology 1997;8:12-7. 10.1097/00001648-199701000-00002 pmid:9116087. - DOI - PubMed
-
- Ransohoff DF, Feinstein AR. Problems of spectrum and bias in evaluating the efficacy of diagnostic tests. N Engl J Med 1978;299:926-30. 10.1056/NEJM197810262991705 pmid:692598. - DOI - PubMed
MeSH terms
Grants and funding
LinkOut - more resources
Full Text Sources
Other Literature Sources