. 2016 Aug;5(8):1067-78.
doi: 10.5966/sctm.2015-0281. Epub 2016 Jun 22.

Apoptosis-Resistant Cardiac Progenitor Cells Modified With Apurinic/Apyrimidinic Endonuclease/Redox Factor 1 Gene Overexpression Regulate Cardiac Repair After Myocardial Infarction

Affiliations

Apoptosis-Resistant Cardiac Progenitor Cells Modified With Apurinic/Apyrimidinic Endonuclease/Redox Factor 1 Gene Overexpression Regulate Cardiac Repair After Myocardial Infarction

Tatsuya Aonuma et al. Stem Cells Transl Med. 2016 Aug.

Abstract

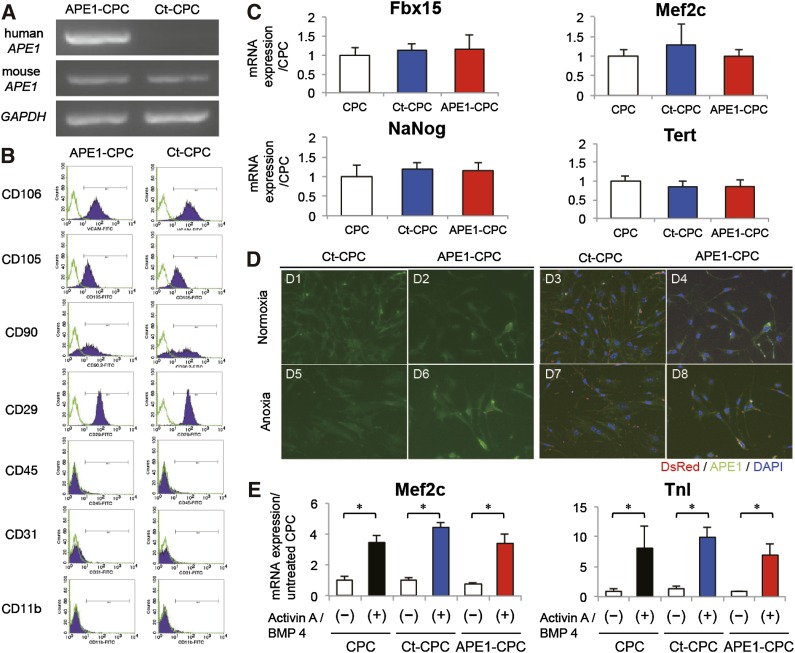
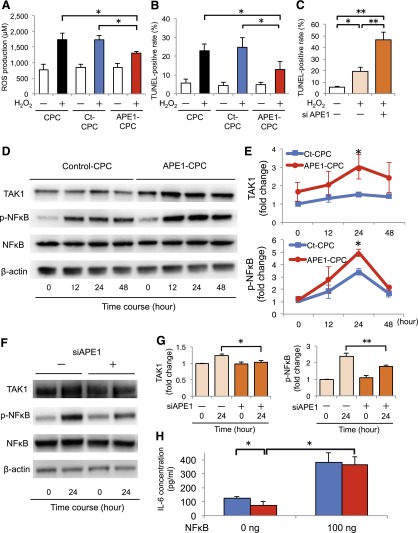
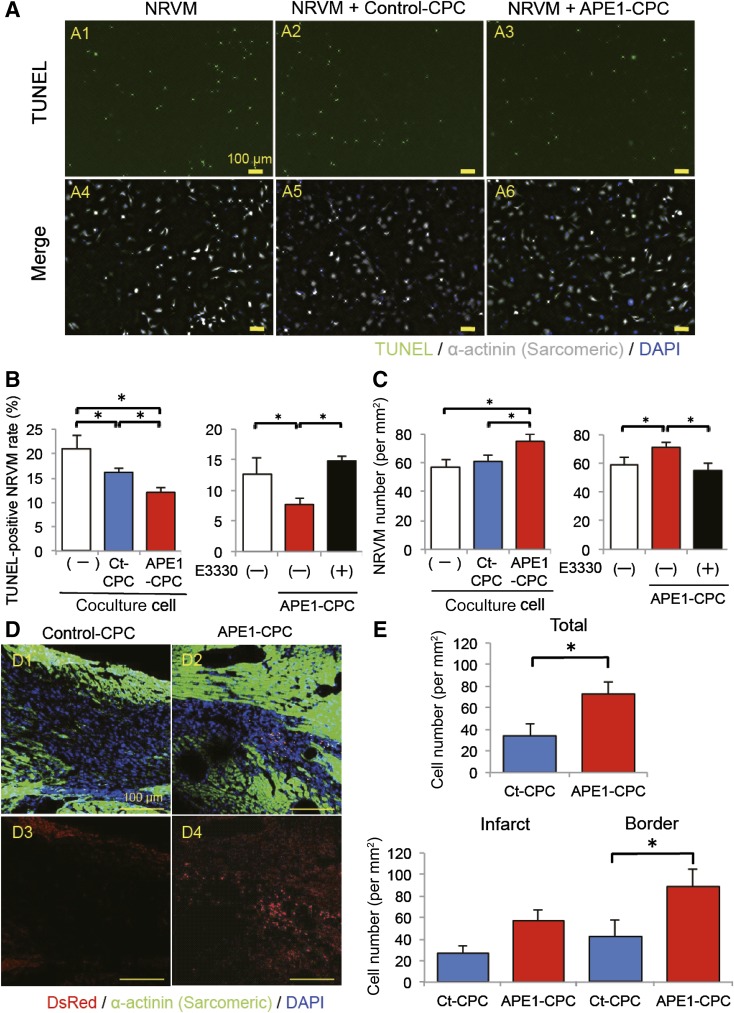
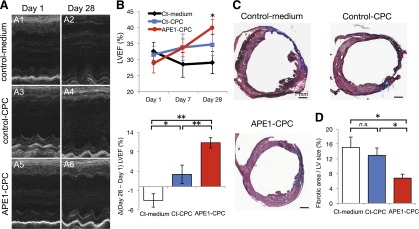
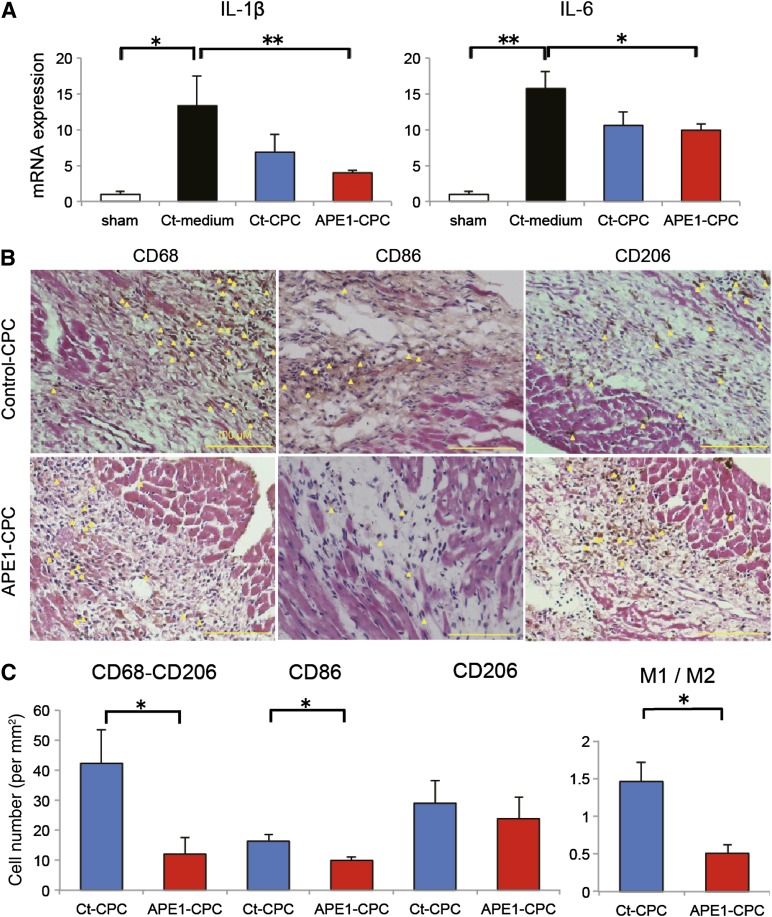
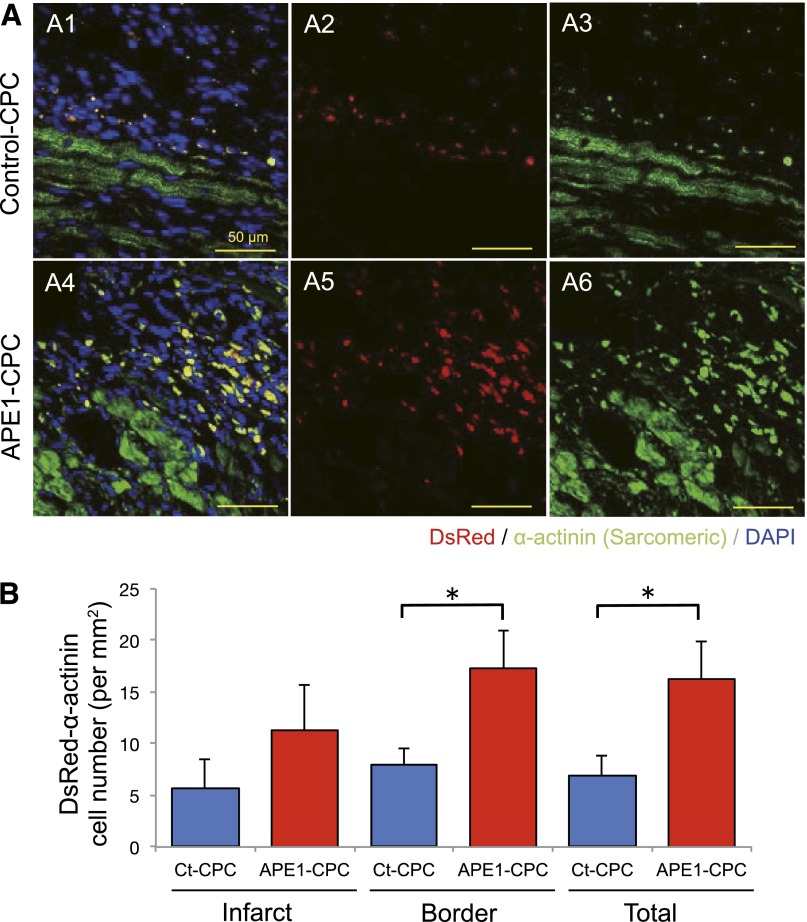
: Overcoming the insufficient survival of cell grafts is an essential objective in cell-based therapy. Apurinic/apyrimidinic endonuclease/redox factor 1 (APE1) promotes cell survival and may enhance the therapeutic effect of engrafted cells. The aim of this study is to determine whether APE1 overexpression in cardiac progenitor cells (CPCs) could ameliorate the efficiency of cell-based therapy. CPCs isolated from 8- to 10-week-old C57BL/6 mouse hearts were infected with retrovirus harboring APE1-DsRed (APE1-CPC) or a DsRed control (control-CPC). Oxidative stress-induced apoptosis was then assessed in APE1-CPCs, control-CPCs, and neonatal rat ventricular myocytes (NRVMs) cocultured with these CPCs. This analysis revealed that APE1 overexpression inhibited CPC apoptosis with activation of transforming growth factor β-activated kinase 1 (TAK1) and nuclear factor (NF)-κB. In the coculture model, NRVM apoptosis was inhibited to a greater extent in the presence of APE1-CPCs compared with control-CPCs. Moreover, the number of surviving DsRed-positive CPC grafts was significantly higher 7 days after the transplant of APE1-CPCs into a mouse myocardial infarction model, and the left ventricular ejection fraction showed greater improvement with attenuation of fibrosis 28 days after the transplant of APE1-CPCs compared with control-CPCs. Additionally, fewer inflammatory macrophages and a higher percentage of cardiac α-sarcomeric actinin-positive CPC-grafts were observed in mice injected with APE1-CPCs compared with control-CPCs after 7 days. In conclusion, antiapoptotic APE1-CPC graft, which increased TAK1-NF-κB pathway activation, survived effectively in the ischemic heart, restored cardiac function, and reduced cardiac inflammation and fibrosis. APE1 overexpression in CPCs may serve as a novel strategy to improve cardiac cell therapy.

Significance: Improving the survival of cell grafts is essential to maximize the efficacy of cell therapy. The authors investigated the role of APE1 in CPCs under ischemic conditions and evaluated the therapeutic efficacy of transplanted APE1-overexpressing CPCs in a mouse model of myocardial infarction. APE1 hindered apoptosis in CPC grafts subjected to oxidative stress caused in part by increased TAK1-NF-κB pathway activation. Furthermore, APE1-CPC grafts that effectively survived in the ischemic heart restored cardiac function and attenuated fibrosis through pleiotropic mechanisms that remain to be characterized. These findings suggest that APE1 overexpression in CPCs may be a novel strategy to reinforce cardiac cell therapy.

Keywords: Apoptosis; Cellular therapy; Gene expression; Sca-1; Stem/progenitor cell.


Figures

Figure 1.
Figure 1.
Characteristics of APE1-overexpressing CPCs. (A): Exogenous human APE1 levels as determined by RT-PCR; expression was detected in APE1-CPCs but not control-CPCs. There was no difference in the expression level of endogenous mouse-APE1 between the two cell lines. (B): Analysis of cell surface marker expression in control-CPCs and APE1-CPCs (n = 3, respectively). Both cells were positive for vascular cell adhesion molecule, CD106, CD 29, CD105, and CD90 and negative for CD31, CD45, and CD11b. (C): Quantitative RT-PCR analysis showed the mRNA expression of transcriptional genes. There was no difference in the expression level of mouse Nanog (n = 10); F-box-containing protein 15 (Fbx15: n = 6), myocyte enhancer factor 2c (Mef2c; n = 6), and telomerase reverse transcriptase (Tert; n = 6) between the three cell lines. (D): Intracellular localization of APE1-protein in normoxic and anoxic conditions (n = 3, respectively). Left: green, APE1; right: merged image of APE1 (green), DsRed (red), and cell nuclei (blue). Magnification ×40. (E): Quantitative RT-PCR analysis showed the ratio of mRNA expression of cardiogenesis genes (Mef2c, troponin-I) compared with untreated CPCs in the three cell lines (n = 4, respectively). ∗, p < .05. Abbreviations: APE1, apurinic/apyrimidinic endonuclease/redox factor 1; BMP, bone morphogenetic protein; CD, cluster of differentiation; CPC, cardiac progenitor cell; Ct, control; DAPI, 4′,6-diamidino-2-phenylindole; GAPDH, glyceraldehyde-3-phosphate dehydrogenase; RT-PCR, reverse transcription-polymerase chain reaction; TnI, troponin I.
Figure 2.
Figure 2.
H2O2-induced ROS production and apoptosis in CPCs via activation of TAK1/NF-κB signaling. (A): Graph of dichloro-dihydro-fluorescein diacetate concentration (ROS production) after H2O2 treatment for 3 hours (n = 4 per group). (B): Number of TUNEL-positive apoptotic cells after H2O2 treatment for 48 hours (n = 6 per group). (C): Percentage of apoptotic CPCs transfected with siRNA against APE1 gene after H2O2 treatment overnight (n = 5, per group). (D): Representative blots of TAK1 and NF-κB expression in APE1-CPCs and control-CPCs upon TNF-α stimulation. (E): Fold change of TAK1 activation (top) and NF-κB phosphorylation (p-NF-κB; bottom) against baseline of control-CPCs (n = 7 per group). (F): Representative blots of TAK1 and NF-κB expression in CPCs with or without APE1 knockdown (siAPE1). (G): Fold change in TAK1 activation (left) and p-NF-κB (right) in APE1-CPCs relative to control-CPCs; after 24 hours of stimulation with TNF-α (n = 10 and 7 per group for TAK1 and p-NF-κB, respectively). (H): NF-κB/IL-6 ELISA assay (n = 5, respectively). Blue bar, control-CPC; red bar, APE1-CPC. ∗, p < .05, ∗∗, p < .01. Abbreviations: APE1, apurinic/apyrimidinic endonuclease/redox factor 1; CPC, cardiac progenitor cell; Ct, control; ELISA, enzyme-linked immunosorbent assay; IL, interleukin; NF, nuclear factor; ROS, reactive oxygen species; siRNA, short interfering RNA; TAK1, transforming growth factor β-activated kinase 1; TNF, tumor necrosis factor; TUNEL, terminal deoxynucleotidyl transferase dUTP nick-end labeling.
Figure 3.
Figure 3.
The mode of action of CPCs to ex vivo and in vivo ischemic heart. (A): Representative images of TUNEL-positive cells (green); nuclei were stained with DAPI (blue). NRVMs were labeled with an antibody against cardiac α-SA (white) (A1, A4, NRVM; A2, A5, NRVM + control-CPC; A3, A6; NRVM + APE1-CPC). Image magnification ×10. (B): Number of TUNEL-positive apoptotic NRVMs. Significantly decreased number of apoptotic NRVMs cocultured with APE1-CPCs compared with control-CPCs (n = 6, NRVM; n = 8, NRVM + control-CPC, NRVM + APE1-CPC) and increased number of TUNEL-positive apoptotic NRVMs cocultured with APE1-CPCs by E3330 exposure (n = 6). Percentage of apoptotic NRVMs, as evaluated by the TUNEL assay. (C): Quantitative analysis of the number of NRVMs after 3 days under anoxic conditions and decreased number of NRVMs cocultured with APE1-CPCs by E3330 exposure (n = 6). (D): CPC grafts in host ischemic hearts 7 days after injection. Representative micrographs of cardiac tissue sections in control-CPC (D1, D3) and APE1-CPC (D2, D4) mice (top: merged image of transplanted cells [red], cardiac α-sarcomeric actinin [green], and cell nuclei [blue]; bottom: transplanted cells [red] and cell nuclei [blue]). Image magnification ×20. (E): Number of DsRed-positive CPC grafts in total ischemic, infarct, and border areas of the host heart (n = 6 per group). ∗, p < .05. Abbreviations: APE1, apurinic/apyrimidinic endonuclease/redox factor 1; CPC, cardiac progenitor cell; Ct, control; DAPI, 4′,6-diamidino-2-phenylindole; NRVM, neonatal rat ventricular myocyte; SA, sarcomeric actinin; TUNEL, terminal deoxynucleotidyl transferase dUTP nick-end labeling.
Figure 4.
Figure 4.
Cardiac function and fibrotic area by transplantation of CPCs. (A): Representative images of M-mode echocardiogram (short axis view) at the midlevel of the heart on days 1 (A1, A3, A5) and 28 (A2, A4, A6) post-MI. A1, A2, control-medium; A3, A4, control-CPC; A5, A6, APE1-CPC. (B): Absolute changes in LVEF on days 1, 7, and 28 (n = 9 per group) (top) (∗∗, p < .01 control-medium vs. APE1-CPC at day 28) and ΔLVEF (day 28 – day 1) in three groups (bottom). (C): Representative images of cardiac tissue sections (short axis view) with Masson’s trichrome staining on day 28 post-MI. Fibrotic areas are stained blue. (C1): Control-medium. (C2): Control-CPC. (C3): APE1-CPC. (D): Quantitative analysis of the percentage fibrotic area as a function of total LV area (n = 9 per group). ∗, p < .05, ∗∗, p < .01. Abbreviations: APE1, apurinic/apyrimidinic endonuclease/redox factor 1; CPC, cardiac progenitor cell; Ct, control; LV, left ventricle; LVEF, left ventricular ejection fraction; MI, myocardial infarction; n.s., not significant.
Figure 5.
Figure 5.
Cardiac inflammation attenuated by transplantation of CPCs. (A): Quantitative RT-PCR analysis of mRNA expression in the heart tissue of proinflammatory cytokines IL-1β and IL-6 (n = 5 per group). (B): M1 and M2 macrophage activation in host ischemic heart 7 days post-MI. Representative cardiac tissue sections (hematoxylin and eosin staining) labeled with antibodies against CD68 (M1 and M2), CD86 (M1), and CD206 (M2) in the ischemic area. Yellow arrowheads indicate CD68-, CD86-, or CD206-positive macrophages (brown; 3,3-diaminobenzidine: DAB substrate). Scale bar, 100 μm. (C): Quantitative analysis of the number of M1 (CD68+CD206 and CD86+) and M2 (CD206+) macrophages in the ischemic area and M1/M2 ratio (n = 6 per group). ∗, p < .05, ∗∗, p < .01. Abbreviations: APE1, apurinic/apyrimidinic endonuclease/redox factor 1; CD, cluster of differentiation; CPC, cardiac progenitor cell; Ct, control; IL, interleukin; MI, myocardial infarction; RT-PCR, reverse transcription-polymerase chain reaction.
Figure 6.
Figure 6.
Cardiomyocyte differentiation of CPC grafts in host ischemic heart. (A): Confocal micrographs of cardiac tissue sections from control-CPC (A1–A3) and APE1-CPC (A4–A6) mice labeled for cardiac α-SA expression on day 7 after injection. Middle: transplanted cells (red); right: cardiac α-SA (green); left: merged image of transplanted cells (red), cardiac α-SA (green), and cell nuclei stained with DAPI (blue). (B): Number of CPC grafts positive for cardiac α-SA in the total ischemic area and border and infarct areas. (C): Ratio of cardiac α-SA-positive CPC grafts in each area (n = 6 per group). Scale bar, 50 μm. ∗, p < .05. Abbreviations: APE1, apurinic/apyrimidinic endonuclease/redox factor 1; CPC, cardiac progenitor cell; Ct, control; DAPI, 4′,6-diamidino-2-phenylindole; SA, sarcomeric actinin.

Similar articles

Cited by

References

    1. Malliaras K, Marbán E. Cardiac cell therapy: where we’ve been, where we are, and where we should be headed. Br Med Bull. 2011;98:161–185. - PMC - PubMed
    1. Assmus B, Honold J, Schächinger V, et al. Transcoronary transplantation of progenitor cells after myocardial infarction. N Engl J Med. 2006;355:1222–1232. - PubMed
    1. Stamm C, Kleine HD, Choi YH, et al. Intramyocardial delivery of CD133+ bone marrow cells and coronary artery bypass grafting for chronic ischemic heart disease: Safety and efficacy studies. J Thorac Cardiovasc Surg. 2007;133:717–725. - PubMed
    1. Losordo DW, Henry TD, Davidson C, et al. ACT34-CMI Investigators Intramyocardial, autologous CD34+ cell therapy for refractory angina. Circ Res. 2011;109:428–436. - PMC - PubMed
    1. Menasché P, Alfieri O, Janssens S, et al. The Myoblast Autologous Grafting in Ischemic Cardiomyopathy (MAGIC) trial: First randomized placebo-controlled study of myoblast transplantation. Circulation. 2008;117:1189–1200. - PubMed

Publication types

MeSH terms

Substances