. 2016 Aug 12;90(17):7848-63.
doi: 10.1128/JVI.00537-16. Print 2016 Sep 1.

DC-SIGN and L-SIGN Are Attachment Factors That Promote Infection of Target Cells by Human Metapneumovirus in the Presence or Absence of Cellular Glycosaminoglycans

Affiliations

DC-SIGN and L-SIGN Are Attachment Factors That Promote Infection of Target Cells by Human Metapneumovirus in the Presence or Absence of Cellular Glycosaminoglycans

Leah Gillespie et al. J Virol. .

Abstract

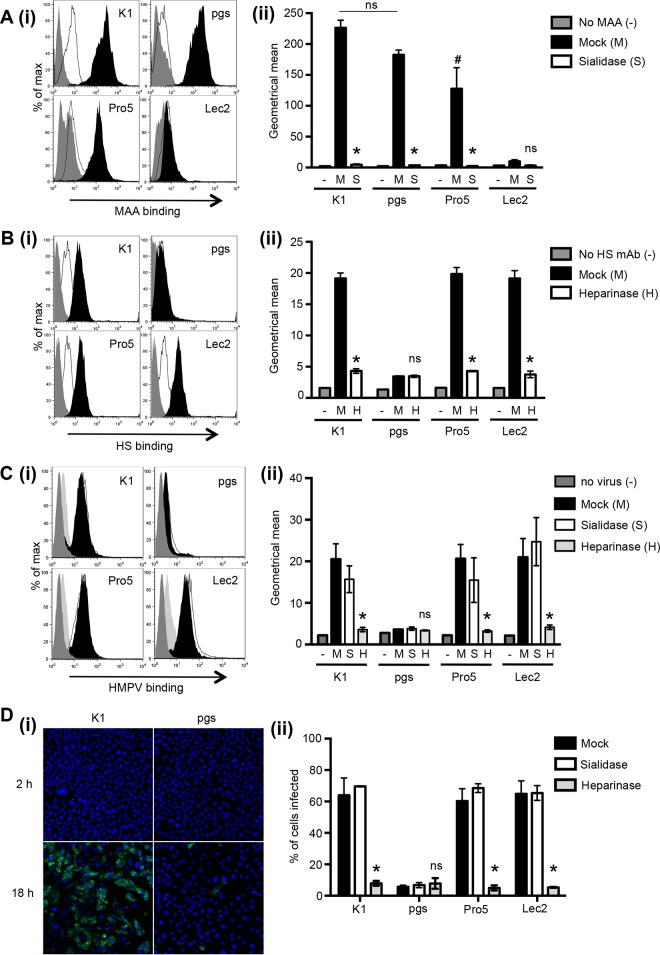
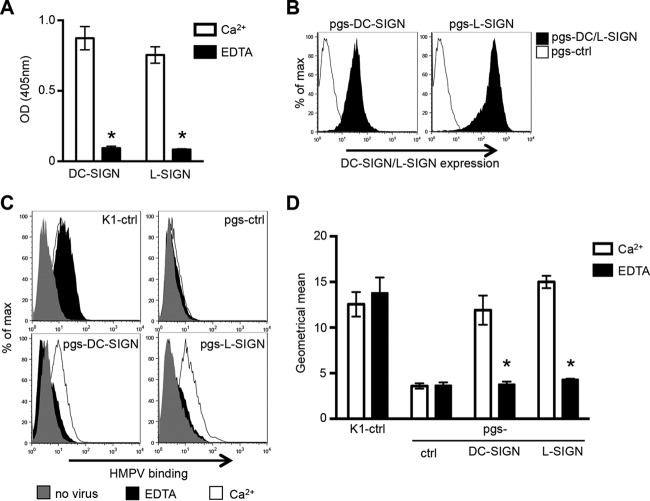
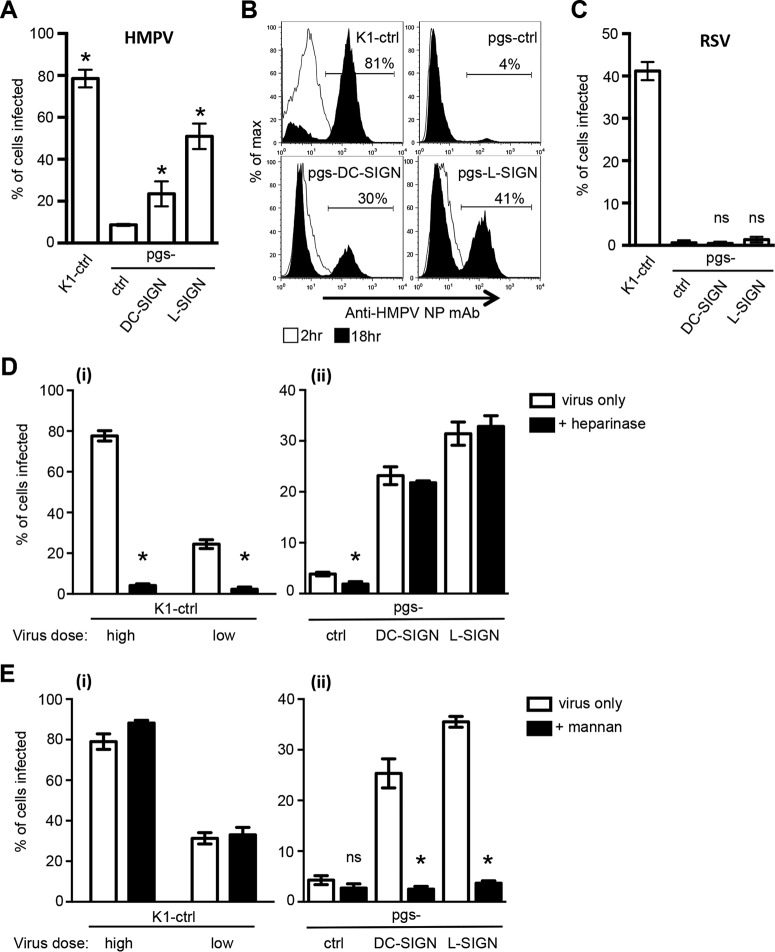
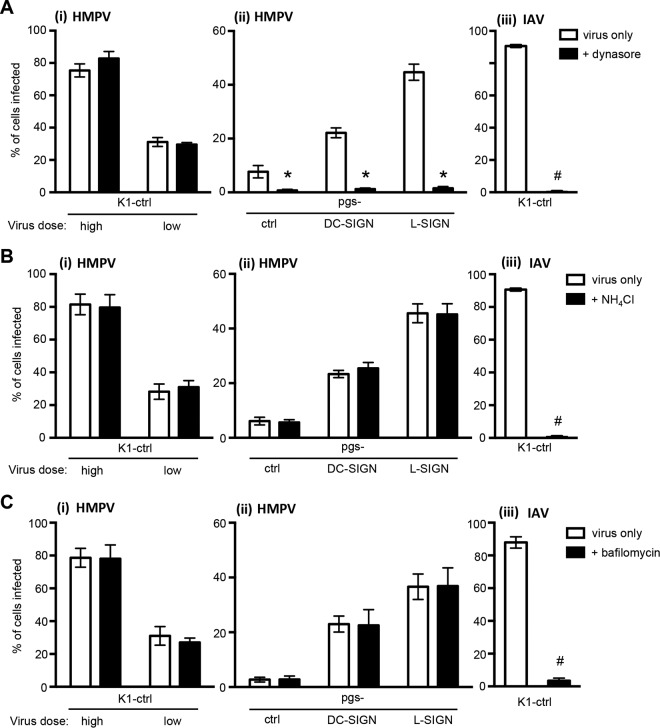
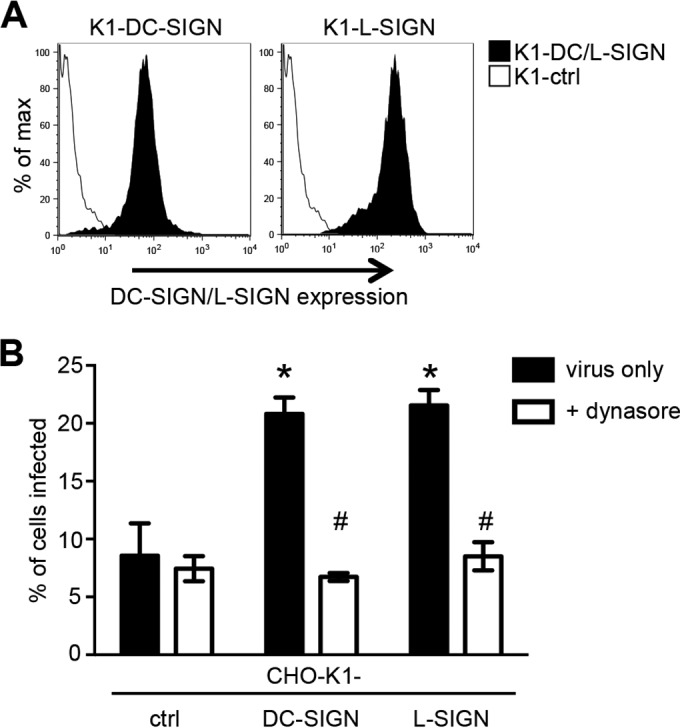
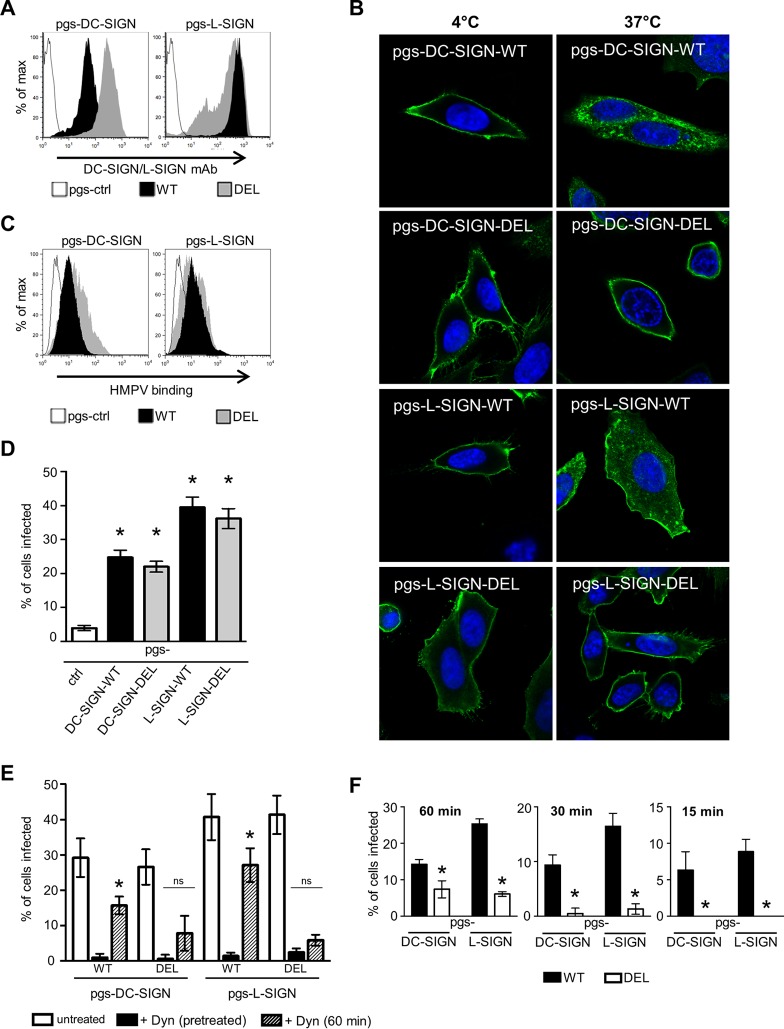
It is well established that glycosaminoglycans (GAGs) function as attachment factors for human metapneumovirus (HMPV), concentrating virions at the cell surface to promote interaction with other receptors for virus entry and infection. There is increasing evidence to suggest that multiple receptors may exhibit the capacity to promote infectious entry of HMPV into host cells; however, definitive identification of specific transmembrane receptors for HMPV attachment and entry is complicated by the widespread expression of cell surface GAGs. pgsA745 Chinese hamster ovary (CHO) cells are deficient in the expression of cell surface GAGs and resistant to HMPV infection. Here, we demonstrate that the expression of the Ca(2+)-dependent C-type lectin receptor (CLR) DC-SIGN (CD209L) or L-SIGN (CD209L) rendered pgsA745 cells permissive to HMPV infection. Unlike infection of parental CHO cells, HMPV infection of pgsA745 cells expressing DC-SIGN or L-SIGN was dynamin dependent and inhibited by mannan but not by pretreatment with bacterial heparinase. Parental CHO cells expressing DC-SIGN/L-SIGN also showed enhanced susceptibility to dynamin-dependent HMPV infection, confirming that CLRs can promote HMPV infection in the presence or absence of GAGs. Comparison of pgsA745 cells expressing wild-type and endocytosis-defective mutants of DC-SIGN/L-SIGN indicated that the endocytic function of CLRs was not essential but could contribute to HMPV infection of GAG-deficient cells. Together, these studies confirm a role for CLRs as attachment factors and entry receptors for HMPV infection. Moreover, they define an experimental system that can be exploited to identify transmembrane receptors and entry pathways where permissivity to HMPV infection can be rescued following the expression of a single cell surface receptor.

Importance: On the surface of CHO cells, glycosaminoglycans (GAGs) function as the major attachment factor for human metapneumoviruses (HMPV), promoting dynamin-independent infection. Consistent with this, GAG-deficient pgaA745 CHO cells are resistant to HMPV. However, expression of DC-SIGN or L-SIGN rendered pgsA745 cells permissive to dynamin-dependent infection by HMPV, although the endocytic function of DC-SIGN/L-SIGN was not essential for, but could contribute to, enhanced infection. These studies provide direct evidence implicating DC-SIGN/L-SIGN as an alternate attachment factor for HMPV attachment, promoting dynamin-dependent infection via other unknown receptors in the absence of GAGs. Moreover, we describe a unique experimental system for the assessment of putative attachment and entry receptors for HMPV.


Figures

FIG 1
FIG 1
Attachment to and infection of CHO-K1, pgsA745, CHO-Pro5, and Lec2 cells by HMPV. (A) Binding of biotinylated MAA to SIA on CHO-K1 (K1), pgsA745 (pgs), CHO-Pro5 (Pro5), and Lec2 cells was determined by flow cytometry. Black histograms represent cells incubated in medium alone, white histograms represent cells incubated in medium supplemented with 100 mU/ml of bacterial sialidase, and gray histograms represent cells stained with FITC-conjugated rabbit anti-mouse IgM/IgG alone [No MAA (−)]. (i) Representative histograms of triplicate samples. (ii) MAA binding represented as the geometric mean fluorescence intensity (±1 standard error of the means) of histograms for triplicate samples. * indicates that binding to sialidase-treated cells is significantly reduced compared to binding to mock-treated cells, and # indicates that binding to CHO-Pro5 mock cells is significantly reduced compared to binding to CHO-K1 mock cells (P < 0.05, as determined by one-way ANOVA followed by Tukey's post hoc test). ns, not significant. (B) Anti-HS MAb binding to GAGs on different CHO cell lines. Cells were incubated in medium alone (black histograms) or medium supplemented with 10 U/ml of bacterial heparinase I (white histograms) and washed, and binding of anti-HS MAb was determined. Gray histograms represent cells stained with FITC-conjugated rabbit anti-mouse IgM/IgG alone [No HS mAb (−)]. (i) Representative histograms for triplicate samples. (ii) Anti-HS MAb binding represented as the geometric mean fluorescence intensity (±1 standard error of the mean) of histograms for triplicate samples. * indicates that anti-HS MAb binding to heparinase-treated cells is significantly different from binding to mock-treated cells (P < 0.05, as determined by one-way ANOVA followed by Tukey's post hoc test). (C) Binding of HMPV to CHO cell lines. Cells were incubated in serum-free medium alone (black histograms) or pretreated with either 100 mU/ml of bacterial sialidase (white histograms) or 10 U/ml of bacterial heparinase I (light gray histograms) and then washed, and virus binding was determined. Dark gray histograms represent cells stained with primary and secondary antibodies only (no virus). (i) Representative histograms of HMPV binding for triplicate samples. (ii) HMPV binding represented as the geometric mean fluorescence intensity (±1 standard error of the mean) of histograms for triplicate samples. * indicates that HMPV binding to heparinase-treated cells is significantly different from binding to mock- and sialidase-treated cells (P < 0.05, as determined by one-way ANOVA followed by Tukey's post hoc test). (D) Infection of CHO cell lines by HMPV. Cell monolayers were incubated with 3 × 10⁵ FFU (MOI of 3 FFU/cell) of HMPV for 1 h at 37°C, washed, incubated for a further 1 h and 17 h, and then fixed and stained for the expression of newly synthesized viral N and DAPI (to stain cell nuclei for total cell counts). (i) Representative images of HMPV-infected CHO-K1 and pgsA745 cells at 2 and 18 h were taken by confocal microscopy. (ii) The percentage of HMPV-infected cells was determined by counting the total number of DAPI+ cells versus FITC+ cells at a ×100 magnification at 18 h postinfection. Data show mean percentages of infection (±1 standard error of the mean) from a minimum of four independent fields per chamber and are representative of results from three independent experiments. * indicates results that are significantly different compared to mock- and sialidase-treated cells for HMPV.
FIG 2
FIG 2
Expression of DC-SIGN or L-SIGN on the surface of GAG-deficient pgsA745 CHO cells is associated with Ca2+-dependent binding of HMPV. (A) ELISA plates coated with purified HMPV were incubated with 1 μg/ml of recombinant DC-SIGN-Fc or L-SIGN-Fc in the presence of 10 mM Ca2+ or 5 mM EDTA. After washing, levels of DC-SIGN/L-SIGN binding were determined as described in Materials and Methods. Data represent the mean optical densities (OD) from triplicate samples (±1 standard error of the mean) and are representative of results from two independent experiments. * indicates that HMPV binding was significantly reduced in the presence of EDTA (P < 0.0001, as determined by unpaired two-tailed Student's t test). (B) Cell surface expression of DC-SIGN or L-SIGN on pgsA745 cells (pgs-DC/L-SIGN) or pgsA745 cells expressing an irrelevant intracellular protein (pgs-ctrl cells) was determined by flow cytometry using a cross-reactive MAb that detects both DC-SIGN and L-SIGN. (C) Binding of HMPV to the surface of CHO-K1-ctrl (K1-ctrl), pgsA745-ctrl (pgs-ctrl), pgs-DC-SIGN, and pgs-L-SIGN cells was determined by flow cytometry in the presence of 10 mM CaCl2 (Ca2+) or 5 mM EDTA. A sample that received no HMPV but was stained with all relevant antibodies was included for comparison (no virus). Representative histograms for triplicate samples are shown. (D) Geometric mean HMPV binding to cells in the presence of 10 mM CaCl2 or 5 mM EDTA (±1 standard error of the mean) from histograms for triplicate samples. Data are representative of results from three independent experiments. * indicates that HMPV binding to pgs-DC-SIGN/L-SIGN cells was significantly reduced with EDTA compared to Ca2+ (P < 0.0001, as determined by two-tailed unpaired Student's t test).
FIG 3
FIG 3
DC-SIGN and L-SIGN facilitate GAG-independent infection of cells by HMPV but not by RSV. (A and B) Monolayers of K1-ctrl, pgs-ctrl, pgs-DC-SIGN, and pgs-L-SIGN cells were incubated with 3 × 10⁵ FFU (MOI of 3 FFU/cell) of HMPV for 60 min at 37°C and then washed and incubated for a further 17 h. (A) Cells were fixed and stained by immunofluorescence for the expression of newly synthesized viral N as described in Materials and Methods. Data represent the mean percentages of HMPV-infected cells (±1 standard error of the mean) from a minimum of four independent fields per chamber and are representative of results of three independent experiments. * indicates values that are significantly increased compared to values for pgs-ctrl cells (P < 0.05, as determined by one-way ANOVA followed by Tukey's post hoc test). (B) Cells were fixed, permeabilized, stained for expression of the HMPV N protein, and then examined by flow cytometry. Histograms show the expression of the HMPV N protein 2 h and 18 h after exposure to HMPV. The percentages of HMPV-infected cells at 18 h postinfection are indicated. (C) Monolayers were infected with 3 × 10⁵ FFU (MOI of 3 FFU/cell) of RSV as described above and assessed by immunofluorescence at 18 h postinfection. Data represent the mean percentages of RSV-infected cells (±1 standard error of the mean) from a minimum of four independent fields per chamber and are representative of results from two independent experiments. ns, not significantly different compared to pgs-ctrl cells (as determined by one-way ANOVA followed by Tukey's post hoc test). (D and E) Monolayers of K1-ctrl, pgs-DC-SIGN, or pgs-L-SIGN cells were incubated at 37°C for 30 min in serum-free medium with 10 mg/ml mannan (+ mannan) or without mannan (virus only) prior to the addition of HMPV (D) or pretreated with 10 U/ml bacterial heparinase at 37°C for 30 min and washed prior to infection with HMPV (E). Note that K1-ctrl cells were inoculated with either a high dose (MOI = 3 FFU/cell) or a low dose (MOI = 0.3 FFU/cell) of HMPV (i), whereas all other cells were inoculated with only a high dose (ii). Cells were incubated for 1 h at 37°C after virus addition, washed, and then cultured for an additional 17 h in the presence (+ mannan) or absence (virus only) of 10 mg/ml mannan. After this time, cells were fixed and stained by immunofluorescence for the presence of newly synthesized viral N. Data represent the mean percentages of infected cells (±1 standard error of the mean) and are pooled from two independent experiments. * indicates that values for mannan-treated cells are significantly reduced compared to those for untreated cells for pgs-DC-SIGN (P < 0.0001) and pgs-L-SIGN (P < 0.0001) cells, as determined by using unpaired two-tailed Student's t test.
FIG 4
FIG 4
DC-SIGN/L-SIGN-mediated infection of GAG-deficient pgsA745 cells by HMPV occurs via a dynamin-dependent, pH-independent route. Monolayers of K1-ctrl, pgs-ctrl, pgs-DC-SIGN, or pgs-L-SIGN cells were treated with 50 μM dynasore (+ dynasore) or mock treated (virus only) (A), with 20 mM NH4Cl (+ NH4Cl) or mock treated (virus only) (B), or with 20 μM bafilomycin (+ bafilomycin) or mock treated (virus only) (C) for 30 min at 37°C and then infected with HMPV. Note that K1-ctrl cells were inoculated with either a high dose (MOI = 3 FFU/cell) or a low dose (MOI = 0.3 FFU/cell) of HMPV (i), whereas all other cells were inoculated with only a high dose (ii). Additional monolayers were inoculated with a standard dose of IAV (iii). After incubation with virus, cells were washed, cultured in serum-free medium alone (virus only) or supplemented with either 50 μM dynasore (+ dynasore) or 20 mM NH4Cl (+ NH4Cl) for an additional 7 h (IAV) or 17 h (HMPV), and then fixed and stained by immunofluorescence for the expression of viral NP/N. Data represent the mean percentages of infected cells (±1 standard error of the mean) from a minimum of four independent fields per chamber and are pooled from results of two independent experiments. In panel A, * indicates that HMPV infection is significantly different from infection of untreated cells (virus only) for pgs-ctrl (P = 0.0100), pgs-DC-SIGN (P < 0.0001), and pgs-L-SIGN (P < 0.0001) cells, and # indicates that IAV infection is significantly different from infection of untreated cells (virus only) for K1-ctrl cells (P < 0.0001) (as determined by two-tailed unpaired Student's t test). In panels B and C, # indicates that IAV infection is significantly different from infection of untreated cells (virus only) for K1-ctrl cells (P < 0.0001) (as determined by two-tailed unpaired Student's t test).
FIG 5
FIG 5
DC-SIGN/L-SIGN expression augments HMPV infection of CHO cells expressing cell surface GAGs. (A) Cell surface expression of DC-SIGN or L-SIGN on CHO-K1 cells (K1-DC/L-SIGN) or CHO-K1 cells expressing an irrelevant intracellular protein (K1-ctrl cells) was determined by flow cytometry using a cross-reactive MAb that detects both DC-SIGN and L-SIGN. (B) Monolayers of K1-ctrl, K1-DC-SIGN, or K1-L-SIGN cells were treated with 50 μM dynasore (+ dynasore) or mock treated (virus only) for 30 min at 37°C. Cells were then infected with 3.7 × 10⁴ FFU (MOI of 0.37 FFU/cell) of HMPV for 1 h at 37°C, washed, and cultured in serum-free medium alone (virus only) or supplemented with either 50 μM dynasore or 20 mM NH4Cl (+ NH4Cl) for an additional 17 h. At this time, cells were fixed and stained by immunofluorescence for the expression of viral N. Data represent the mean percentages of infected cells (±1 standard error of the mean) from a minimum of four independent fields per chamber and are representative of results from three independent experiments. In panel B, * indicates that CHO-K1-DC/L-SIGN cells are significantly enhanced compared to CHO-K1-ctrl cells (P < 0.01, as determined by one-way ANOVA followed by Tukey's post hoc test), and # indicates that for K1-DC-SIGN and K1-L-SIGN cells, mock treatment is significantly different from dynasore treatment for each cell line (P < 0.01, as determined by one-way ANOVA followed by Tukey's post hoc test).
FIG 6
FIG 6
pgsA745 cells expressing endocytosis-defective mutants of DC-SIGN/L-SIGN remain susceptible to HPMV infection. (A) Flow cytometry was used to determine cell surface expression of DC-SIGN (left) or L-SIGN (right) on pgsA745 cells expressing WT or DEL forms of DC-SIGN/L-SIGN. pgsA745-ctrl cells were included to confirm the specificity of binding. (B) Endocytic capacity of pgsA745 cells expressing different forms of DC-SIGN/L-SIGN following cross-linking with antibody. Cell monolayers expressing WT or DEL forms of DC-SIGN/L-SIGN were incubated with an anti-DC-SIGN/L-SIGN MAb for 1 h at 4°C, washed, and incubated for a further 20 min at either 4°C (left) or 37°C (right). Cells were then fixed, stained with Alexa Fluor 488 anti-mouse Ig (green) (to detect anti-DC-SIGN/L-SIGN MAb) and DAPI (blue) (to stain the nucleus), and examined by confocal microscopy. (C) Binding of HMPV to pgsA745 cells expressing WT or DEL forms of DC-SIGN/L-SIGN was determined by flow cytometry. Representative histograms of HMPV binding to pgsA745 cells expressing WT or DEL forms of DC-SIGN/L-SIGN in the presence of 20 mM Ca2+ are shown. pgsA745-ctrl cells were included to confirm the specificity of binding. (D) Cells were incubated with 3 × 10⁵ FFU (MOI of 3 FFU/cell) of HMPV for 1 h, washed, cultured for an additional 17 h, and then fixed and stained for the expression of the HMPV N protein. Data show the mean percentages of infection (±1 standard deviation). * indicates that values are significantly different from those for pgsA745-ctrl cells (P < 0.01, as determined by one-way ANOVA followed by Tukey's post hoc test). No significant differences were observed between pgsA745 cells expressing WT or DEL DC-SIGN and those expressing WT or DEL L-SIGN. (E) To examine endocytic entry during the first 1 h, cells were incubated with 3 × 10⁵ FFU (MOI of 3 FFU/cell) of HMPV for 1 h and washed, and 50 μM dynasore was added during subsequent culture to prevent further endocytosis [+ Dyn (60 min)]. As controls, either cells were pretreated with 50 μM dynasore for 30 min at 37°C and infected with HMPV for 60 min, and dynasore was included in all washing and culture steps [+ Dyn (pretreated)], or cells were infected and incubated with medium alone (untreated). After 18 h, cells were fixed, stained for the expression of the HMPV N protein, and examined by fluorescence microscopy. Data show the mean percentages of infection (±1 standard deviation). * indicates that values for infected cells treated with dynasore are significantly different from those for cells pretreated with dynasore (P < 0.01, as determined by one-way ANOVA followed by Tukey's post hoc test). (F) To gain insight regarding the rate of endocytic entry of HMPV, cells were incubated with 3 × 10⁵ FFU (MOI of 3 FFU/cell) of HMPV for either 60, 30, or 15 min and then washed, and 50 μM dynasore was added to prevent further endocytosis. At 18 h postinfection, cells were fixed, stained, and examined by fluorescence microscopy. * indicates that infection of DEL cells is significantly reduced compared to that of the appropriate WT controls (P < 0.01, as determined by two-tailed unpaired Student's t test).

Similar articles

Cited by

References

    1. Kroll JL, Weinberg A. 2011. Human metapneumovirus. Semin Respir Crit Care Med 32:447–453. doi:10.1055/s-0031-1283284. - DOI - PubMed
    1. Kuiken T, van den Hoogen BG, van Riel DA, Laman JD, van Amerongen G, Sprong L, Fouchier RA, Osterhaus AD. 2004. Experimental human metapneumovirus infection of cynomolgus macaques (Macaca fascicularis) results in virus replication in ciliated epithelial cells and pneumocytes with associated lesions throughout the respiratory tract. Am J Pathol 164:1893–1900. doi:10.1016/S0002-9440(10)63750-9. - DOI - PMC - PubMed
    1. Wyde PR, Chetty SN, Jewell AM, Schoonover SL, Piedra PA. 2005. Development of a cotton rat-human metapneumovirus (hMPV) model for identifying and evaluating potential hMPV antivirals and vaccines. Antiviral Res 66:57–66. doi:10.1016/j.antiviral.2004.12.009. - DOI - PubMed
    1. Kolli D, Gupta MR, Sbrana E, Velayutham TS, Chao H, Casola A, Garofalo RP. 2014. Alveolar macrophages contribute to the pathogenesis of human metapneumovirus infection while protecting against respiratory syncytial virus infection. Am J Respir Cell Mol Biol 51:502–515. doi:10.1165/rcmb.2013-0414OC. - DOI - PMC - PubMed
    1. Guerrero-Plata A, Casola A, Suarez G, Yu X, Spetch L, Peeples ME, Garofalo RP. 2006. Differential response of dendritic cells to human metapneumovirus and respiratory syncytial virus. Am J Respir Cell Mol Biol 34:320–329. doi:10.1165/rcmb.2005-0287OC. - DOI - PMC - PubMed

Publication types

LinkOut - more resources