. 2016 Jun 22;14(1):49.
doi: 10.1186/s12951-016-0204-y.

Designing, construction and characterization of genetically encoded FRET-based nanosensor for real time monitoring of lysine flux in living cells

Affiliations

Designing, construction and characterization of genetically encoded FRET-based nanosensor for real time monitoring of lysine flux in living cells

Seema Ameen et al. J Nanobiotechnology. .

Abstract

Background: Engineering microorganisms in order to improve the metabolite flux needs a detailed knowledge of the concentrations and flux rates of metabolites and metabolic intermediates in vivo. Fluorescence resonance energy transfer (FRET) based genetically encoded nanosensors represent a promising tool for measuring the metabolite levels and corresponding rate changes in live cells. Here, we report the development of a series of FRET based genetically encoded nanosensor for real time measurement of lysine at cellular level, as the improvement of microbial strains for the production of L-lysine is of major interest in industrial biotechnology.

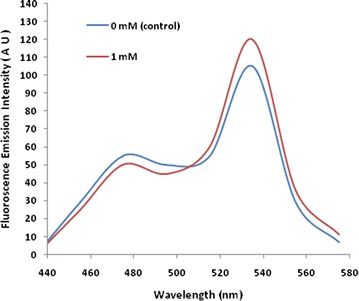
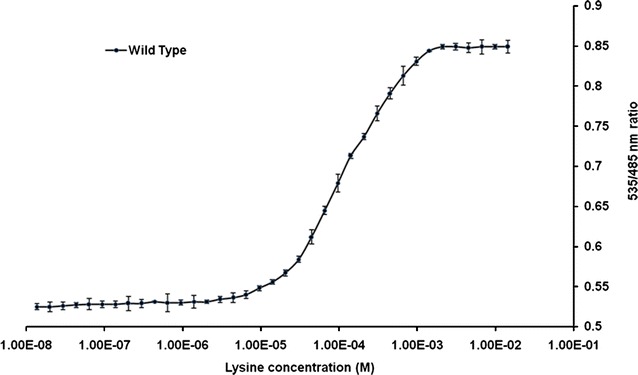
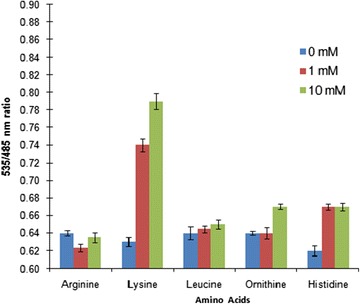
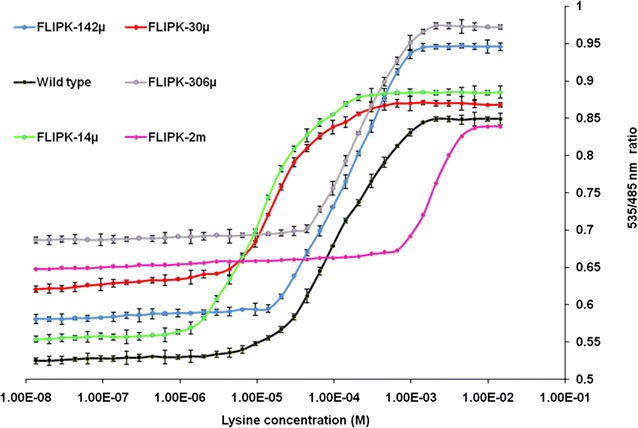
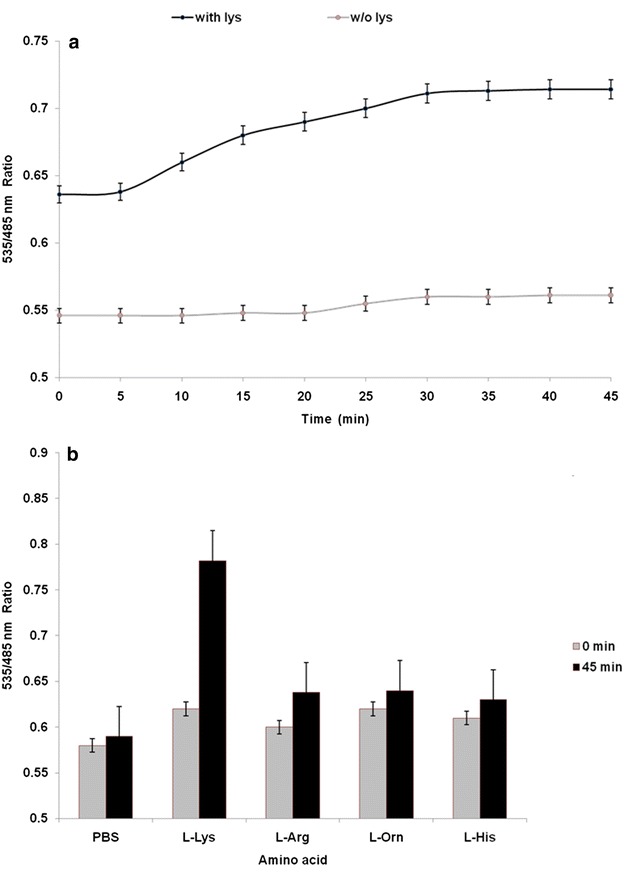
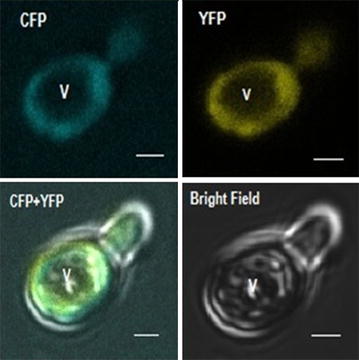
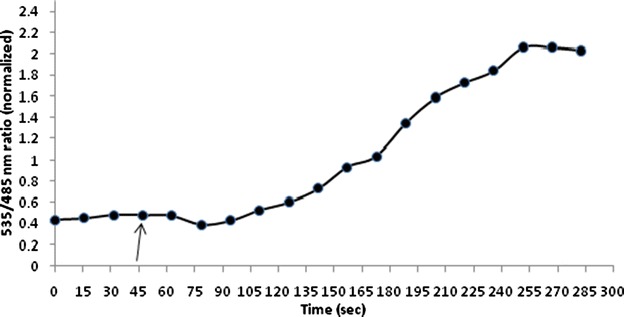
Results: The lysine binding periplasmic protein (LAO) from Salmonella enterica serovar typhimurium LT2 strain was used as the reporter element for the sensor. The LAO was sandwiched between GFP variants i.e. cyan fluorescent protein (CFP) and yellow fluorescent protein (YFP). Affinity, pH stability, specificity and metal ions effects was scrutinized for the in vitro characterization of this nanosensor, named as FLIPK. The FLIPK is specific to lysine and found to be stable with the pH within the physiological range. The calculated affinity (K d ) of FLIPK was 97 µM. For physiological applications, mutants with different binding affinities were also generated and investigated in vitro. The developed nanosensor efficiently monitored the intracellular level of lysine in bacterial as well as yeast cell.

Conclusion: The developed novel lysine fluorescence resonance energy transfer sensors can be used for in vivo monitoring of lysine levels in prokaryotes as well as eukaryotes. The potential of these sensors is that they can be used as reporter tools in the development of metabolically engineered microbial strains or for real-time monitoring of intracellular lysine during fermentation.

Keywords: Fluorescent protein; Fluorescent resonance energy transfer (FRET); Genetically encoded nanosensor; Lysine; Periplasmic binding protein.


Figures

Fig. 1
Fig. 1
Schematic representation of nanosensor. a Ligand free form of LAOBP from S. typhimurium showing the N-terminus and C-terminus, b linear representation of the nanosensor construct and c schematic representation of the lysine induced conformational change in the LAOBP. With the result of binding of lysine to LAOBP, CFP and YFP come closer to each other. Emission of CFP at this stage excites the YFP. Ratio of YFP/CFP emission (FRET ratio) changed as compared to unbound stage
Fig. 2
Fig. 2
In vitro fluorescence emission spectrum of FLIPK. The fluorescence emission was recorded by excitation at 435 nm in fluorometer without lysine (0 mM) and with lysine (1 mM). The concentration of sensor protein was 0.25 mg/ml
Fig. 3
Fig. 3
FRET measurement of WT sensor. Lysine titration curve for FLIPK. Purified sensor proteins were diluted with 20 mM PBS buffer. FRET (535/485 nm ratio) was measured at various concentrations of lysine. The concentration of sensor protein was 0.19 mg/ml. Values are means of three independent replicates. Vertical bars indicate the standard error
Fig. 4
Fig. 4
pH stability of the FRET signal of FLIPK. YFP/CFP emission ratios were measured in PBS buffer with different pH, in the absence (blue) and in the presence (red) of 1 mM of lysine. Stability increases with pH while the sensor stabilizes above pH 7.0. Concentration of sensor protein was 0.16 mg/ml. Values are means of three independent replicates. Vertical bars indicate the standard error
Fig. 5
Fig. 5
In vitro analysis of FLIPK (WT) nanosensor. Ligand specificity of the FLIPK. Concentration of sensor protein was 0.20 mg/ml. Values are means of three independent replicates. Vertical bars indicate the standard error
Fig. 6
Fig. 6
In vitro ligand dependent FRET ratio change of FLIPK in the presence of l-lysine. Affinity mutants Y14A, R77L, F52A, D161I and S72A were developed. Mutations at position 14 tyrosine substituted by alanine (Y14A), arginine 77 to leucine (R77L), phenylalanine 52 to alanine (F52A), and aspartic acid 161 to isoleucine (D161I) and serine at 72 position by alanine (S72A). Concentration of sensor protein was 0.24 mg/ml. Values are means of three independent replications. Vertical bars indicate standard error
Fig. 7
Fig. 7
In vivo analysis of the FLIPK (WT) nanosensor. a FRET ratio change in response to the 10 mM lysine (black circles) and without lysine (grey circles) in 20 mM PBS buffer. b FRET (535/485 nm) ratio of the bacterial cell suspension before and after incubation with various amino acids for 45 min
Fig. 8
Fig. 8
Confocal imaging of FLIPK (WT) expressing yeast cell. FLIPK is detected in the cytosol, whereas no signal was found in the vacuole (V). (Bar = 1 µm)
Fig. 9
Fig. 9
Lysine concentration change in the cytosol of yeast. S. cerevisiae/URA3 strain BY4742 expressing the sensor FLIPK. The graph indicates the emission intensity ratio (535/485 nm ratio) for a single yeast cell. Addition of 100 mM lysine (shown by arrow) increased the ratio by 2.0

References

    1. Ma SM, Li JWH, Choi JW, Zhou H, et al. Complete reconstitution of a highly reducing iterative polyketide synthase. Science. 2009;326:589–592. doi: 10.1126/science.1175602. - DOI - PMC - PubMed
    1. Kimura E. l-Glutamate production. In: Eggeling L, Bott M, editors. Handbook of Cornybacterium glutamicum. Boca Raton: CRC Press; 2005. pp. 439–464.
    1. Hanbler E, Burkovski A. Molecular mechanisms of nitrogen control in corynebacteria. In: Burkovski A, editor. Corynebacteria: genomics and molecular biology. UK: Caister Academic Press, Norfolk; 2008. pp. 183–201.
    1. Eggeling L. Amino acids. In: Ratledge C, Kristiansen B, editors. Basic biotechnology. London: Cambridge University Press; 2001. pp. 281–303.
    1. Becker J, Wittmann C. Systems and synthetic metabolic engineering for amino acid production—the heartbeat of industrial strain development. Curr Opin Biotechnol. 2012;23:718–726. doi: 10.1016/j.copbio.2011.12.025. - DOI - PubMed

MeSH terms