

Reviewing deaths in British and US hospitals: a study of two scales for assessing preventability
- PMID: 27334868
- PMCID: PMC5530333
- DOI: 10.1136/bmjqs-2015-004849
Reviewing deaths in British and US hospitals: a study of two scales for assessing preventability
Abstract
Background: Standardised mortality ratios do not provide accurate measures of preventable mortality. This has generated interest in using case notes to assess the preventable component of mortality. But, different methods of measurement have not been compared. We compared the reliability of two scales for assessing preventability and the correspondence between them.
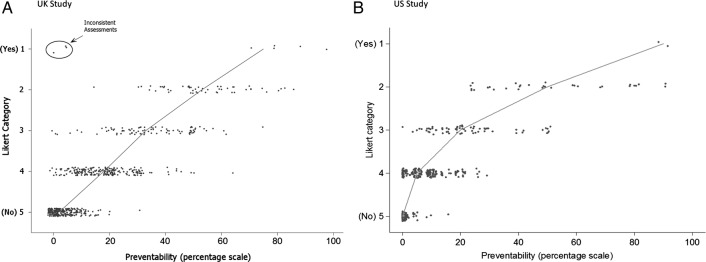
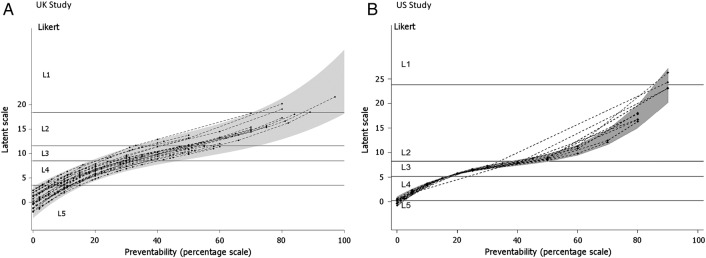
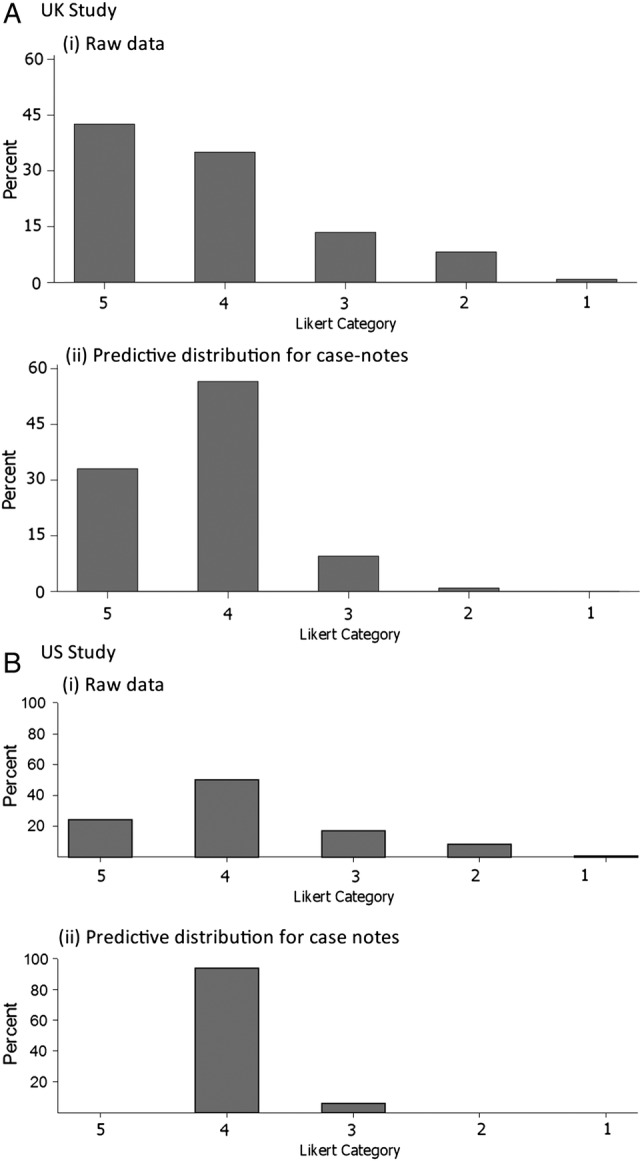
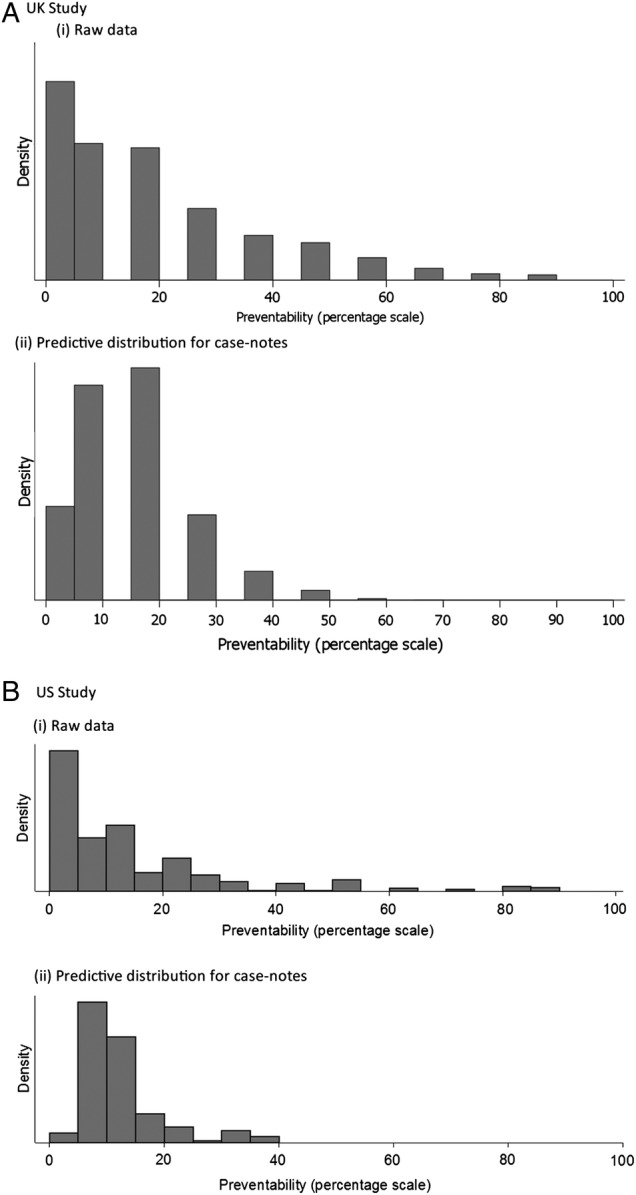
Methods: Medical specialists reviewed case notes of patients who had died in hospital, using two instruments: a five-point Likert scale and a continuous (0-100) scale of preventability. To enhance generalisability, we used two different hospital datasets with different types of acute medical patients across different epochs, and in two jurisdictions (UK and USA). We investigated the reliability of measurement and correspondence of preventability estimates across the two scales. Ordinal mixed effects regression methods were used to analyse the Likert scale and to calibrate it against the continuous scale. We report the estimates of the probability a death could have been prevented, accounting for reviewer inconsistency.
Results: Correspondence between the two scales was strong; the Likert categories explained most of the variation (76% UK, 73% USA) in the continuous scale. Measurement reliability was low, but similar across the two instruments in each dataset (intraclass correlation: 0.27, UK; 0.23, USA). Adjusting for the inconsistency of reviewer judgements reduced the proportion of cases with high preventability, such that the proportion of all deaths judged probably or definitely preventable on the balance of probability was less than 1%.
Conclusions: The correspondence is high between a Likert and a continuous scale, although the low reliability of both would suggest careful measurement design would be needed to use either scale. Few to no cases are above the threshold when using a balance of probability approach to determining a preventable death, and in any case, there is little evidence supporting anything more than an ordinal correspondence between these reviewer estimates of probability and the true probability. Thus, it would be more defensible to use them as an ordinal measure of the quality of care received by patients who died in the hospital.
Keywords: Adverse events, epidemiology and detection; Medical error, measurement/epidemiology; Mortality (standardized mortality ratios); Quality improvement methodologies.
Published by the BMJ Publishing Group Limited. For permission to use (where not already granted under a licence) please go to http://www.bmj.com/company/products-services/rights-and-licensing/.
Conflict of interest statement
Figures
References
Publication types
MeSH terms
Grants and funding
LinkOut - more resources
Full Text Sources
Other Literature Sources