. 2016 Oct:94:139-56.
doi: 10.1016/j.nbd.2016.06.011. Epub 2016 Jun 19.

Calcineurin β protects brain after injury by activating the unfolded protein response

Affiliations

Calcineurin β protects brain after injury by activating the unfolded protein response

Yanan Chen et al. Neurobiol Dis. 2016 Oct.

Abstract

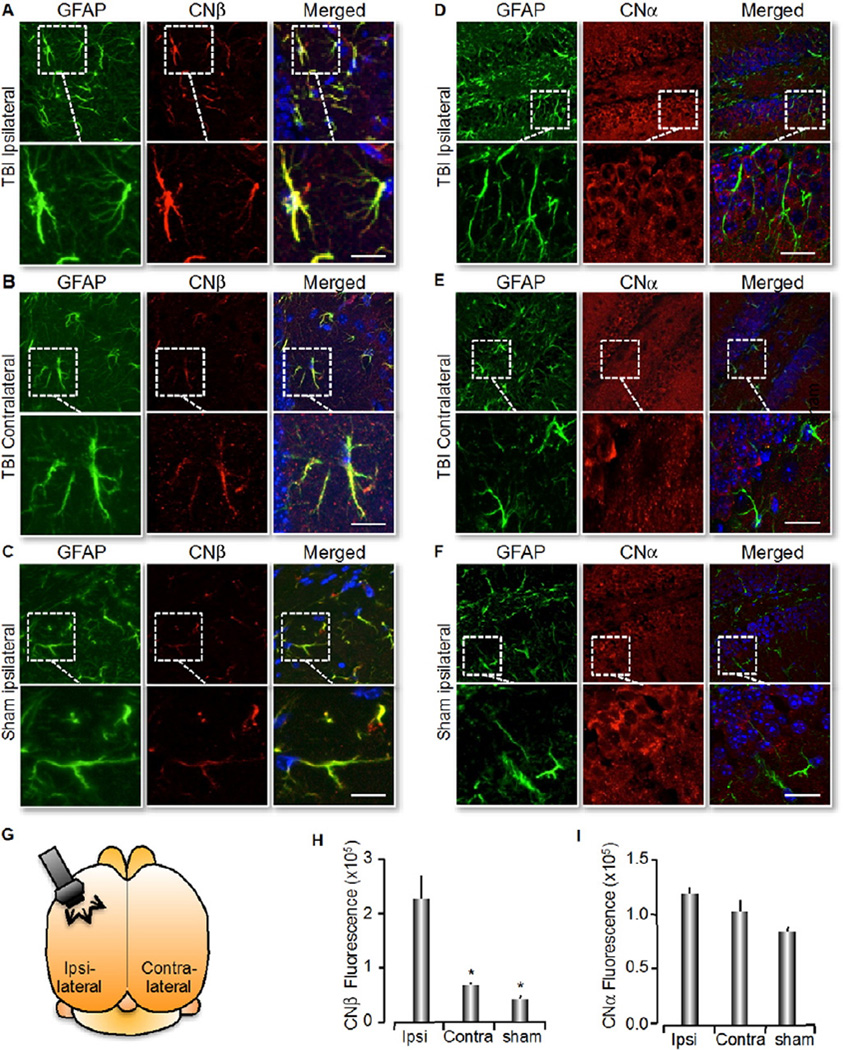
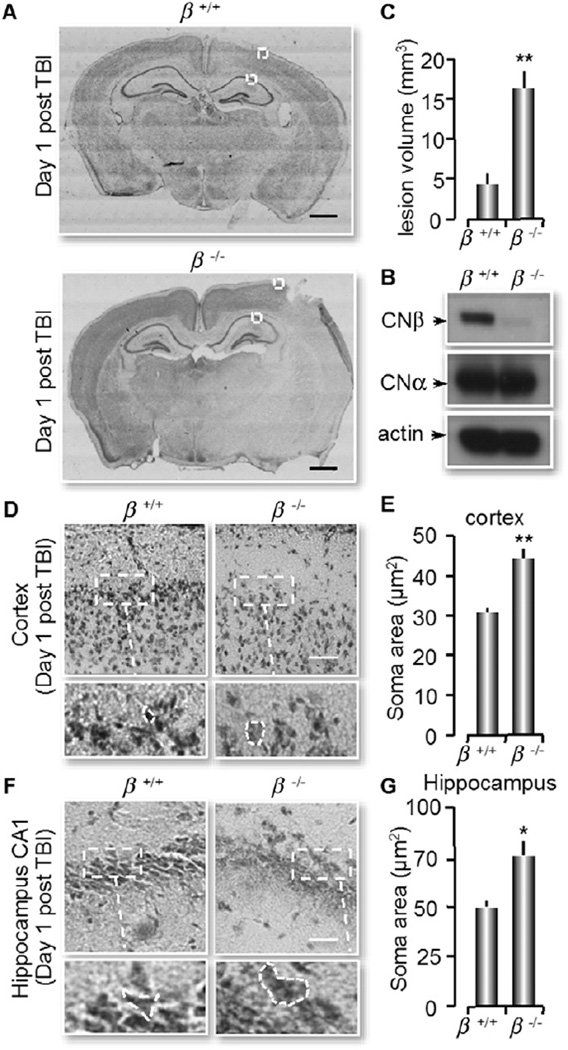
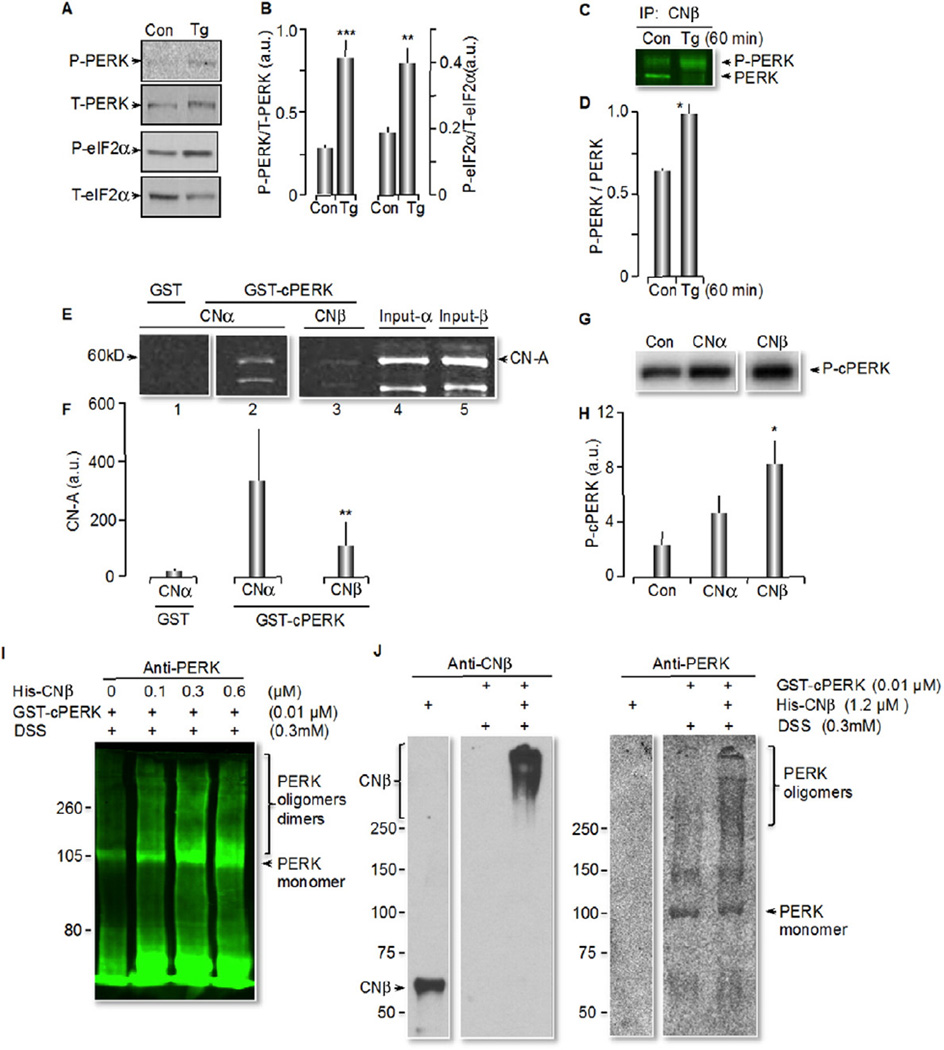
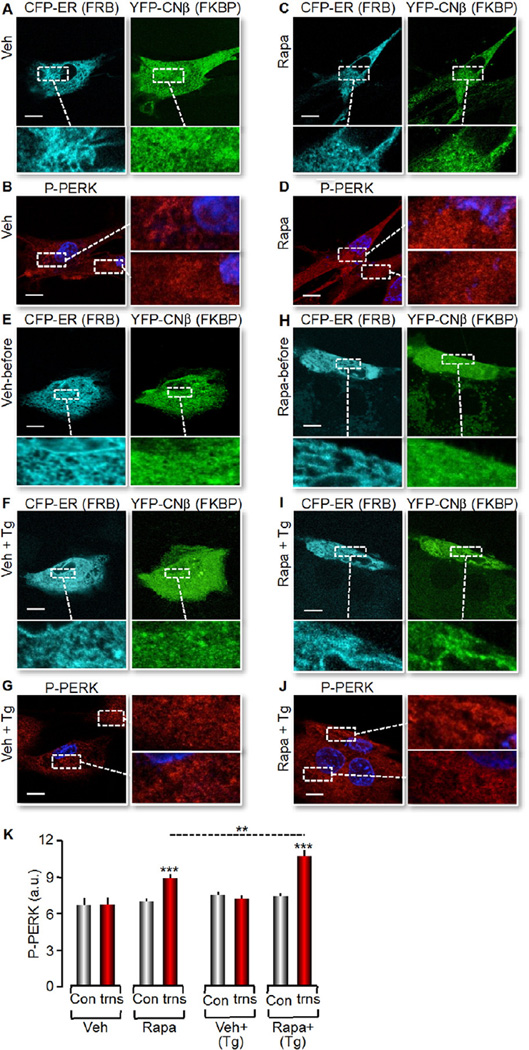
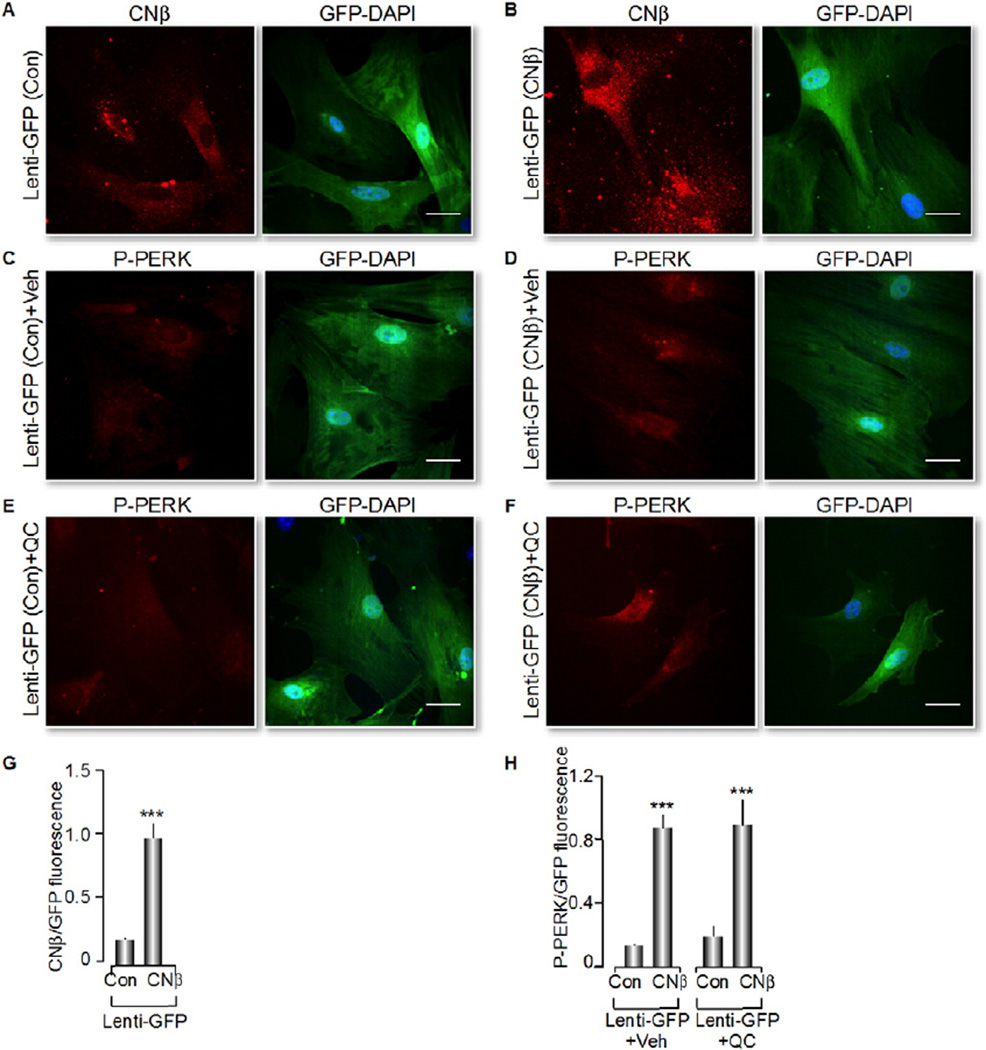
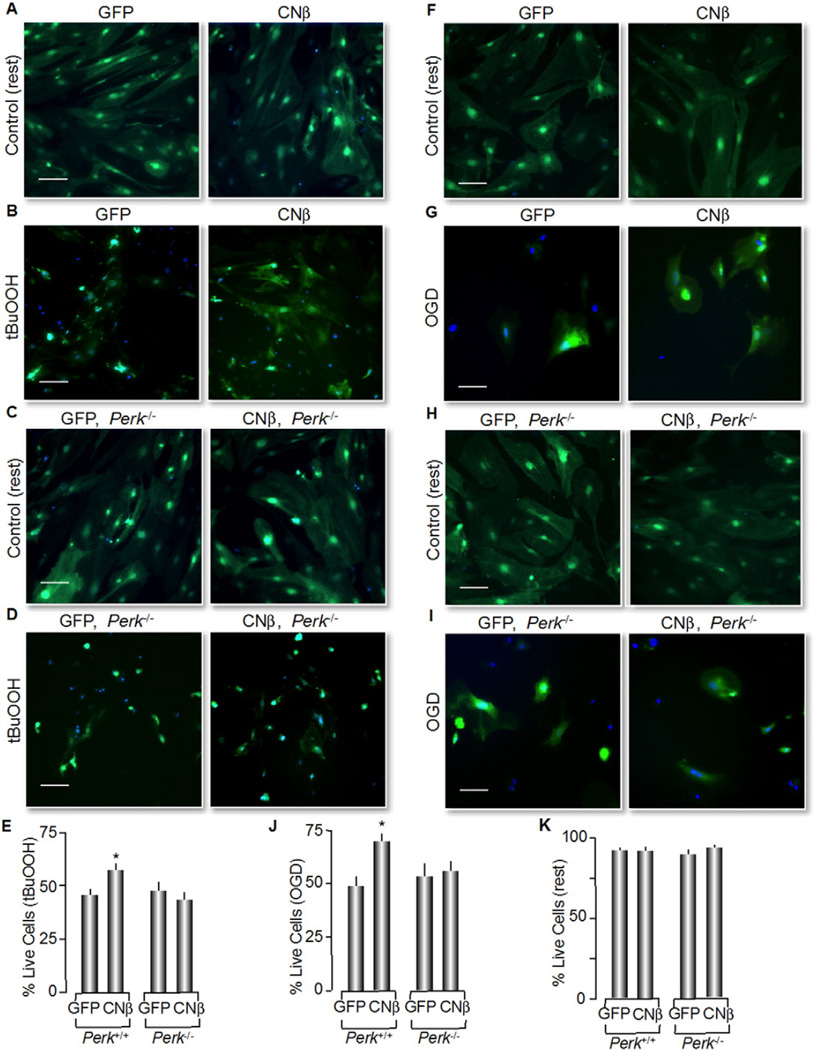
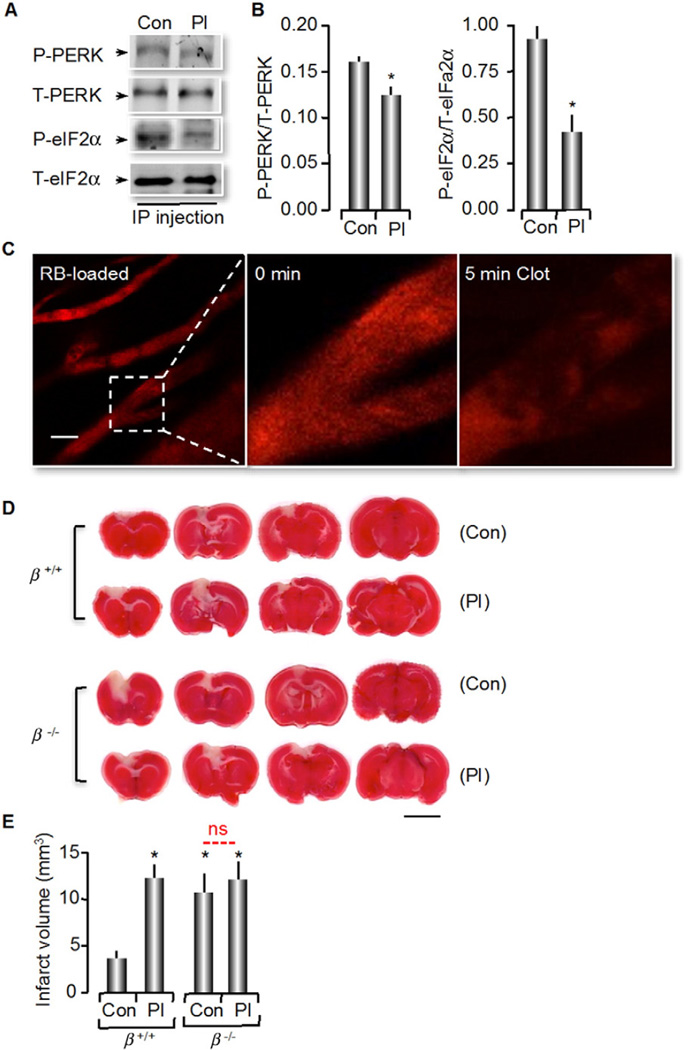
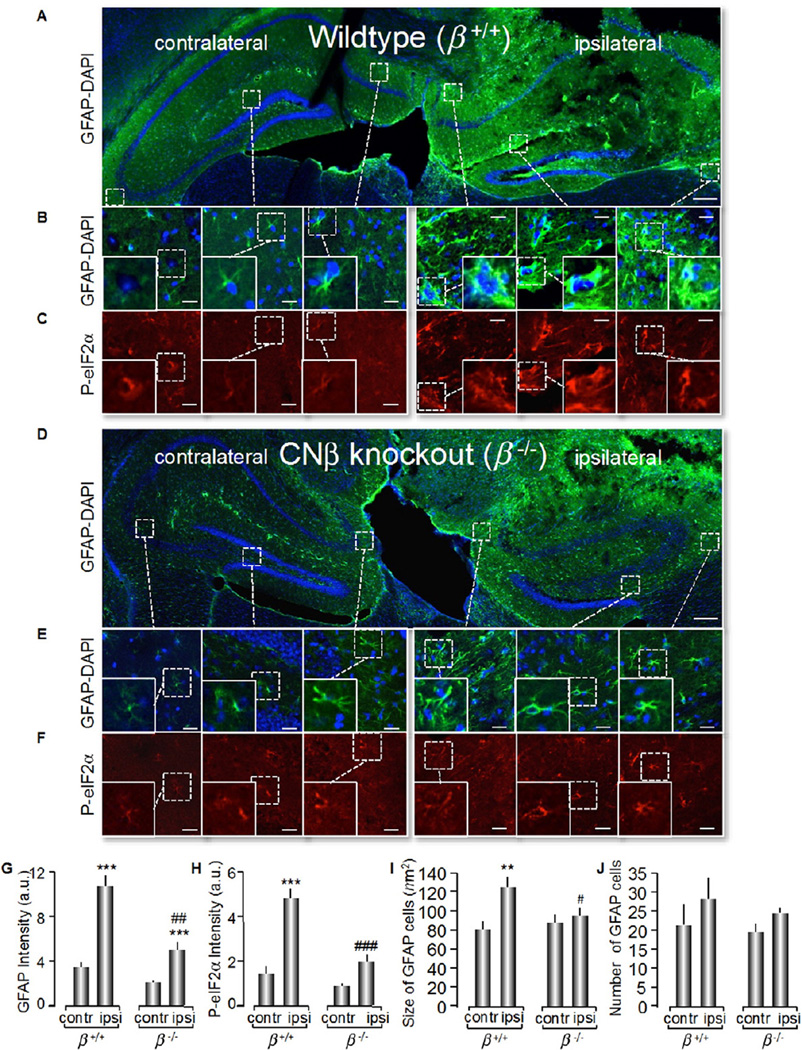
The Ca(2+)-dependent phosphatase, calcineurin (CN) is thought to play a detrimental role in damaged neurons; however, its role in astrocytes is unclear. In cultured astrocytes, CNβ expression increased after treatment with a sarco/endoplasmic reticulum Ca(2+)-ATPase inhibitor, thapsigargin, and with oxygen and glucose deprivation, an in vitro model of ischemia. Similarly, CNβ was induced in astrocytes in vivo in two different mouse models of brain injury - photothrombotic stroke and traumatic brain injury (TBI). Immunoprecipitation and chemical activation dimerization methods pointed to physical interaction of CNβ with the unfolded protein response (UPR) sensor, protein kinase RNA-like endoplasmic reticulum kinase (PERK). In accordance, induction of CNβ resulted in oligomerization and activation of PERK. Strikingly, the presence of a phosphatase inhibitor did not interfere with CNβ-mediated activation of PERK, suggesting a hitherto undiscovered non-enzymatic role for CNβ. Importantly, the cytoprotective function of CNβ was PERK-dependent both in vitro and in vivo. Loss of CNβ in vivo resulted in a significant increase in cerebral damage, and correlated with a decrease in astrocyte size, PERK activity and glial fibrillary acidic protein (GFAP) expression. Taken together, these data reveal a critical role for the CNβ-PERK axis in not only prolonging astrocyte cell survival but also in modulating astrogliosis after brain injury.

Keywords: Calcium; Endoplasmic reticulum; Ischemia; Stress; Traumatic brain injury.


Conflict of interest statement

Conflict of interest

The authors declare that they have no conflict of interest.

Figures

Fig. 1
Fig. 1
CNβ, but not CNα, expression increases in astrocytes in vivo after TBI. Representative Z-projection merged images of mice brains harvested 24 h post-TBI and stained with antibodies against CNβ or CNα (red), GFAP (green) and DAPI (nuclei, blue). Images were acquired on an Olympus FV1000 confocal microscope. (A, D) Ipsilateral side of TBI brain sections; (B, E) Contralateral side of TBI brain sections; (C, F) Brain sections from sham mice. (G) Schematic diagram of brain undergoing TBI. Ipsilateral and contralateral sides of trauma are labeled. (H, I) Quantification of fluorescence intensity in panels above from 3 mice (n = 3, mean ± SEM, *p < 0.05 by one-way ANOVA). Scale bar: 10 µm (A–C); 20 µm (D–F).
Fig. 2
Fig. 2
CNβ null mice exhibit higher lesion volume and increased cytotoxic edema in neurons after TBI. (A) Nissl staining of coronal sections from CNβ wildtype (β+/+) and null (β−/−) mice 24 h post-TBI. Dashed boxes represent areas shown in D and F, respectively. Scale bar: 1 µm. (B) Immunoblots of homogenized brain lysates from β+/+ and β−/− mice for CNα and CNβ. Actin was used as a loading control. (C) Quantification of lesion volume by Nissl staining shown in (A) (n = 3, mean ± SEM, *p< 0.05, by unpaired two-tailed Student’s t-test). (D, F) Higher magnification images from the cortex and the CA1 region of the hippocampus from β+/+ and β−/− mice. Scale bar: 10 µm. (E, G) Quantification of averaged neuron soma size in the cortex and the CA1 region of the hippocampus after TBI, respectively (n = 3, mean ± SEM, *p < 0.05, **p < 0.01 by unpaired two-tailed Student’s t-test).
Fig. 3
Fig. 3
CNβ physically interacts with PERK and promotes PERK phosphorylation and oligomerization. (A) C8D1A type I astrocytes were treated with vehicle (DMSO; Con) or 1 µM of thapsigargin (Tg) for 1 h. Cell lysates were analyzed for total (T) and phosphorylated (P) PERK and eIF2α using immunoblots. (B) Densitometry histograms after normalization to T-PERK or T-eIF2α, respectively (n = 3, mean ± SEM, **p < 0.01 and ***p < 0.001 by unpaired two-tailed Student’s t-test). (C) Primary mouse astrocytes were treated as indicated in (A) and then cross-linked with disuccinimidyl suberate (DSS) for 30 min. Immunoprecipitation (IP) was performed with anti-CNβ antibody and subsequent blots were probed with anti-PERK antibody. (D) Quantification of P-PERK/T-PERK densitometric ratio in (C) (n = 3, mean ± SEM, *p < 0.05 by unpaired two-tailed Student’s t test). (E) GST pull-down assay with either 8 nM of CNα or CNβ. The proteins were incubated with glutathione sepharose 4B for 1 h, resolved on a 12% SDS-polyacrylamide gel and probed with an anti-calcineurin PAN-A antibody. CN pull-down levels are shown for GST alone and GST-cPERK. (F) Densitometric histogram of (E) (n = 3, mean ± SEM, **p < 0.01 by unpaired two-tailed Student’s t test). (G) GST-cPERK was added to all reaction mixtures along with [g32P] ATP in the absence or the presence of either of 0.043 mM of CNα or CNβ. Reaction mixtures were run on SDS-PAGE and visualized by autoradiography. (H) Quantification of cPERK auto-phosphorylation density (ne = 5, mean ± SEM, *p < 0.05 by one-way ANOVA). (I) Recombinant His-CNβ and GST-cPERK were incubated at the concentrations indicated, in the presence of 0.3 mM of DSS cross-linker for 30 min at room temperature. The ensuing protein complexes were run on SDS-PAGE and detected by immunoblotting using an anti-PERK antibody. (J) Recombinant His-CNβ (1.2 mM) and GST-cPERK (0.01 mM) were incubated in the presence of 0.3 mM of DSS for 30 min at room temperature. The protein complexes were run on SDS-PAGE and detected by immunoblotting using antibodies against CNβ and PERK.
Fig. 4
Fig. 4
Rapamycin induces CNβ translocation to ER membrane and thereby promotes PERK phosphorylation. (A,C) Confocal images of human astrocytes expressing CFP-FRB-cytochrome 5 (cb5, ER anchor) and YFP-FKBP-CNβ after addition of 100 nM of rapamycin (Rapa) for 30 min that induced translocation of the CNβ construct to the ER. DMSO-treated cells were used as controls (Veh). (E–F, H–I) Confocal images of cells before and after addition of 100 nM of rapa for the first 10 min and then 25 nM Tg for an additional 20 min. DMSO and Tg treatments were used as controls (Veh + Tg). (B, D, G, J) Immunocyto-chemistry was immediately performed to detect P-PERK (red). Nuclei were stained with DAPI (blue) in cells. Scale bar: 20 µm. (K) Quantification of fluorescence intensity of P-PERK in untransfected (Con) and transfected cells (trns) in (B, D, G, J) (n > 20 cells per group, mean ± SEM, **p < 0.01, ***p < 0.001 by one-way ANOVA).
Fig. 5
Fig. 5
CNβ induces PERK phosphorylation independent of its phosphatase activity. (A, B) Primary astrocytes cultured from wildtype mice were transduced with pUltra lentivirus containing empty vector (Lenti-GFP Con) or Lenti-GFP (CNβ) and stained for CNβ (red). Nuclei were stained with DAPI (blue). Presence of virus is indicated by GFP (green). (C–F ) Infected astrocytes were exposed to DMSO (Veh) or 40 µM of Quercetin (QC) for 20 min. Immuno-cytochemistry was carried out for P-PERK (red) and DAPI (blue). Images were sequentially acquired. Scale bar: 20 µm. (G) Ratio of fluorescence intensity (CNβ/GFP) in (A, B) from three independent experiments in which at least 10 cells were quantified per experiment (mean ± SEM, ***p < 0.001 by unpaired two-tailed Student’s t-test). (H) Ratio of fluorescence intensity (P-PERK/GFP) in (C–F) from three independent experiments in which at least 10 cells were quantified per experiment (mean ± SEM, ***p < 0.001 by one-way ANOVA).
Fig. 6
Fig. 6
Lentiviral expression of CNβ increases cell viability of wildtype but not PERK-null astrocytes. (A, C, F, H) Astrocytes cultured from Perk+/+ and Perk−/− mice were infected with lentivirus pUltra lenti-GFP or pUltra lenti-GFP (CNβ) (green). Cells in (B, D) were exposed to tBuOOH for 2 h and cells in (G, I) were exposed to OGD for 1 h. Cells in (K) were at rest. Nuclei were stained using Hoechst 33342 (blue). Cells with GFP expression were viable cells. Scale bar: 80 µm. (E, J) Quantification of percent live cells in lentivirus-infected astrocytes in (B, D, G, I) from three independent experiments in which 5 random fields were counted (mean ± SEM, *p < 0.05 by one-way ANOVA).
Fig. 7
Fig. 7
CNβ null mice exhibit larger infarct size after photo thrombotic stroke as compared to CNβ null mice with inhibition of PERK activity. PERK inhibitor (PI) or DMSO (Con) was intraperitoneally injected into CNβ wildtype (β+/+) and null (β−/−) mice 12 h before stroke. (A) Homogenized brain lysates of mice at 12 h post-injections were analyzed for T-PERK, P-PERK, T-eIF2α and P-eIF2α by immunoblots. (B) Quantification of immunoblots in (A) (n = 3, mean ± SEM, *p < 0.05 by unpaired two-tailed Student’s t-test). (C) Rose bengal (RB) dye-induced photothrombotic model. Confocal images show that blood vessel lumens were filled with RB dye. Region marked by dashed box was irradiated with 543 nm laser light. After approximately 5 min, a thrombotic clot was formed with the absence of blood flow. Scale bar: 20 µm. (D) Tetrazolium chloride (TTC) staining of serial coronal sections 24 h post-photothrombotic stroke on β+/+ and β−/− mice with DMSO (Con) or PI injection. Scale bar: 5 mm. (E) Quantification of infarct volume 24 h post-stroke in (D) (n = 5, mean ± SEM, *p < 0.05 by one-way ANOVA).
Fig. 8
Fig. 8
β+/+, not β−/− mice, exhibit enlarged astrocytes as well as up-regulated P-eIF2α in reactive astrocytes after stroke. Mouse brains harvested at post 24 h of stroke were sectioned and stained with antibodies against P-eIF2α (red), GFAP (green) and DAPI (nuclei, blue). Montage images were acquired on a Zeiss LMS 710 confocal microscopy with a Nikon 20× objective. (A, D) The β+/+ and β−/− brain sections with GFAP and DAPI staining. (B, E) The high magnification of images from the dashed boxes in A and D, respectively. (C, F) The brain sections from B and E in P-eIF2α staining, respectively. (G–J) Quantification of fluorescence intensities of GFAP and P-eIF2α in astrocytes, the size and the number of GFAP positive astrocytes (n = 3, four random regions analyzed from each side, mean ± SEM). **p < 0.01 and ***p < 0.001, compared with the contralateral(contr)side; #p < 0.05, ##p < 0.01 and ###p < 0.001, compared with the ipsilateral (ipsi) side of β+/+ respectively, by 1-way ANOVA. Scale bar: 250 µm (A, D); 20 µm (B, C, E, F).

Similar articles

Cited by

References

    1. Abdul HM, Sama MA, Furman JL, Mathis DM, Beckett TL, Weidner AM, et al. Cognitive decline in Alzheimer’s disease is associated with selective changes in calcineurin/NFAT signaling. J. Neurosci. 2009 Oct 14;29(41):12957–12969. PubMed PMID: 19828810. Pubmed Central PMCID: 2782445) - PMC - PubMed
    1. Agostinho P, Lopes JP, Velez Z, Oliveira CR. Overactivation of calcineurin induced by amyloid-beta and prion proteins. Neurochem. Int. 2008 Mayy;52(6):1226–1233. PubMed PMID: 18295934) - PubMed
    1. Axten JM, Medina JR, Feng Y, Shu A, Romeril SP, Grant SW, et al. Discovery of 7-methyl-5-(1-{[3-(trifluoromethyl)phenyl]acetyl}-2,3-dihydro-1H–indol-5-yl)-7H–p yrrolo[2,3-d]pyrimidin-4-amine (GSK2606414), a potent and selective first-in-class inhibitor of protein kinase R (PKR)-like endoplasmic reticulum kinase (PERK) J. Med. Chem. 2012 Aug 23;55(16):7193–7207. PubMed PMID: 22827572) - PubMed
    1. Badiola N, Penas C, Minano-Molina A, Barneda-Zahonero B, Fado R, Sanchez-Opazo G, et al. Induction of ER stress in response to oxygen-glucose deprivation of cortical cultures involves the activation of the PERK and IRE-1 pathways and of caspase-12. Cell Death Dis. 2011;2:e149. PubMed PMID: 21525936. Pubmed Central PMCID: 3122062. Epub 2011/04/29) - PMC - PubMed
    1. Bertolotti A, Zhang Y, Hendershot LM, Harding HP, Ron D. Dynamic interaction of BiP and ER stress transducers in the unfolded-protein response. Nat. Cell Biol. 2000 Junn;2(6):326–332. PubMed PMID: 10854322. Epub 2000/06/15. eng) - PubMed