. 2016 Jun 22;108(11):djw144.
doi: 10.1093/jnci/djw144. Print 2016 Nov.

Genomic Analysis of Immune Cell Infiltrates Across 11 Tumor Types

Affiliations

Genomic Analysis of Immune Cell Infiltrates Across 11 Tumor Types

Michael D Iglesia et al. J Natl Cancer Inst. .

Abstract

Background: Immune infiltration of the tumor microenvironment has been associated with improved survival for some patients with solid tumors. The precise makeup and prognostic relevance of immune infiltrates across a broad spectrum of tumors remain unclear.

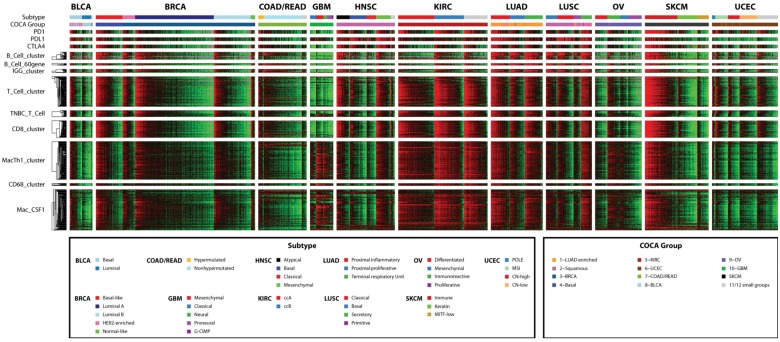
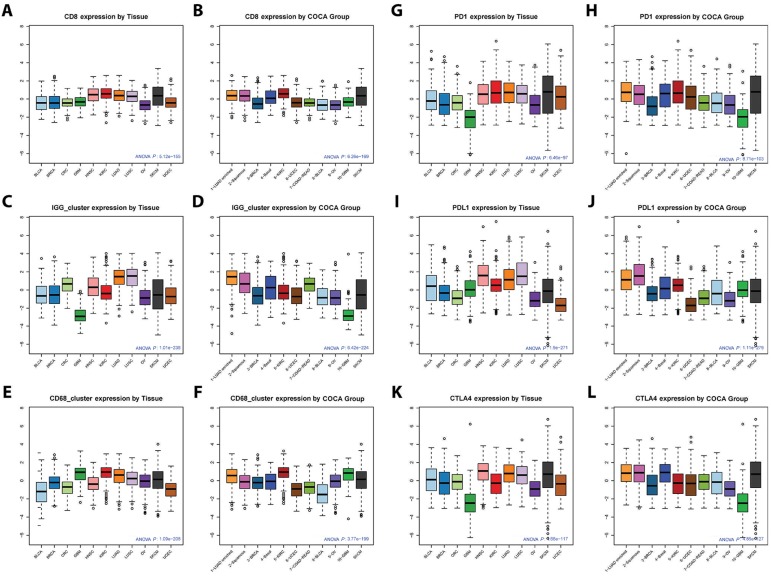
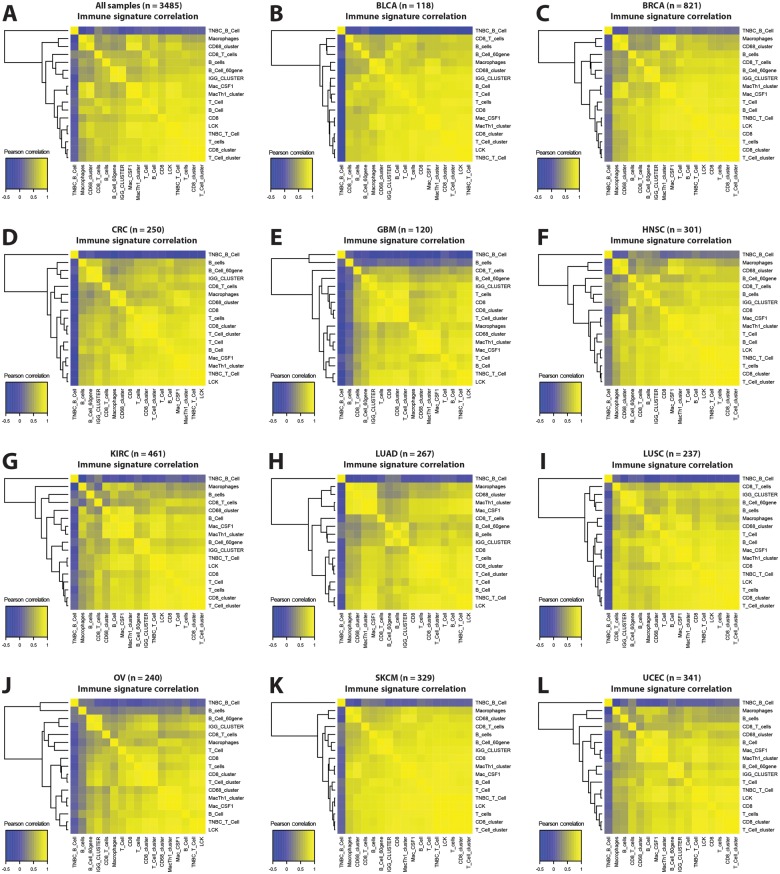
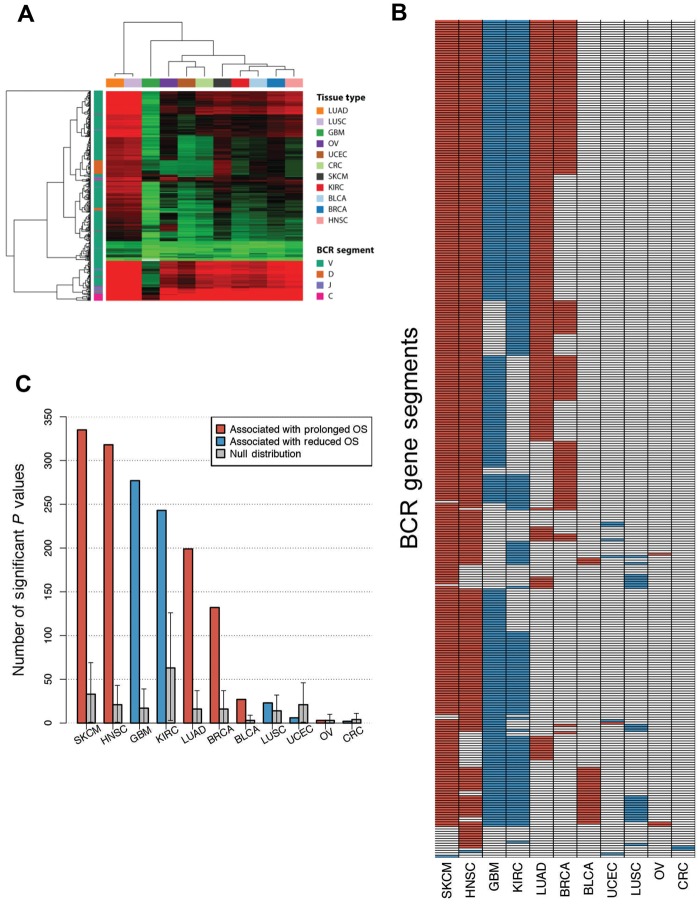
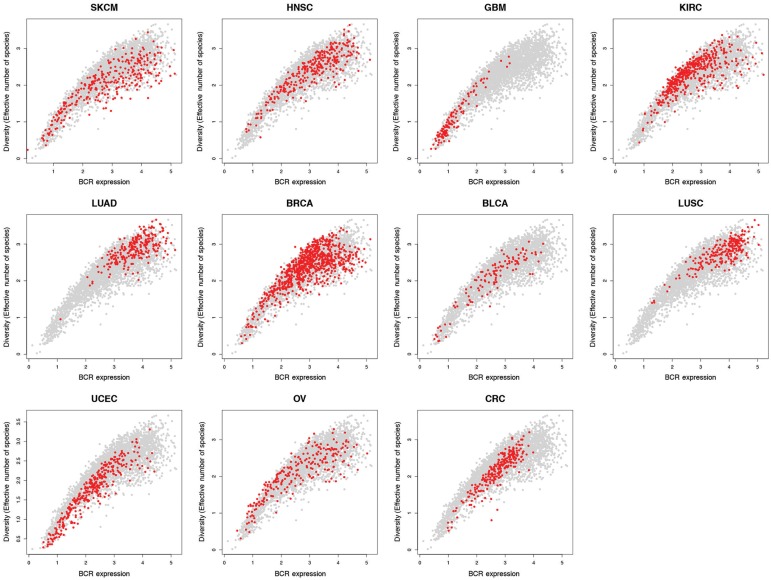
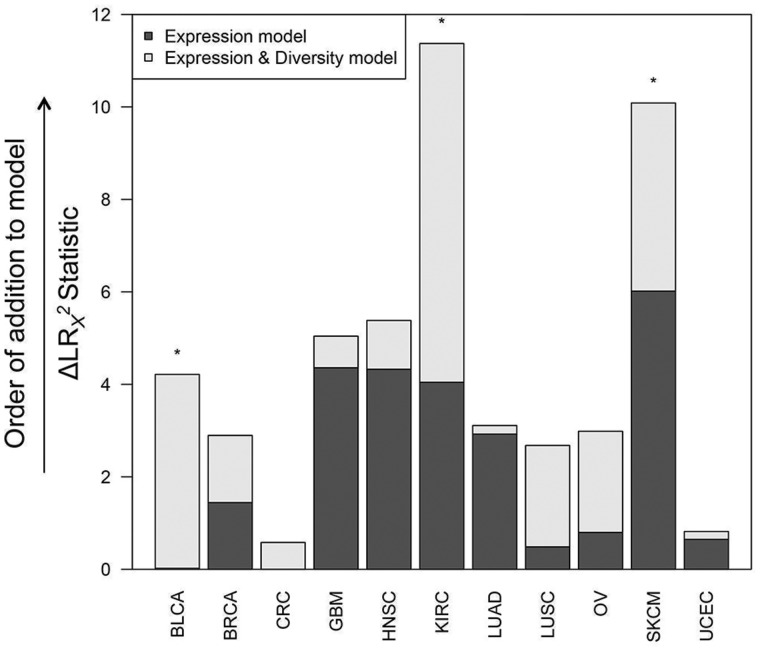
Methods: Using mRNA sequencing data from The Cancer Genome Atlas (TCGA) from 11 tumor types representing 3485 tumors, we evaluated lymphocyte and macrophage gene expression by tissue type and by genomic subtypes defined within and across tumor tissue of origin (Cox proportional hazards, Pearson correlation). We investigated clonal diversity of B-cell infiltrates through calculating B-cell receptor (BCR) repertoire sequence diversity. All statistical tests were two-sided.

Results: High expression of T-cell and B-cell signatures predicted improved overall survival across many tumor types including breast, lung, and melanoma (breast CD8_T_Cells hazard ratio [HR] = 0.36, 95% confidence interval [CI] = 0.16 to 0.81, P = .01; lung adenocarcinoma B_Cell_60gene HR = 0.71, 95% CI = 0.58 to 0.87, P = 7.80E-04; melanoma LCK HR = 0.86, 95% CI = 0.79 to 0.94, P = 6.75E-04). Macrophage signatures predicted worse survival in GBM, as did B-cell signatures in renal tumors (Glioblastoma Multiforme [GBM]: macrophages HR = 1.62, 95% CI = 1.17 to 2.26, P = .004; renal: B_Cell_60gene HR = 1.17, 95% CI = 1.04 to 1.32, P = .009). BCR diversity was associated with survival beyond gene segment expression in melanoma (HR = 2.67, 95% CI = 1.32 to 5.40, P = .02) and renal cell carcinoma (HR = 0.36, 95% CI = 0.15 to 0.87, P = .006).

Conclusions: These data support existing studies suggesting that in diverse tissue types, heterogeneous immune infiltrates are present and typically portend an improved prognosis. In some tumor types, BCR diversity was also associated with survival. Quantitative genomic signatures of immune cells warrant further testing as prognostic markers and potential biomarkers of response to cancer immunotherapy.


Figures

Figure 1.
Figure 1.
Concordant expression of genes from different immune cell types in specific solid tumor types and subtypes. Tumors are ordered by column according to tissue type and subtype. Within signatures, genes are ordered by row by unsupervised hierarchical clustering across all patients. Log 2 gene expression is median-centered across all samples. IGG_Cluster, B_Cell, B_Cells, B_Cell_cluster, B_Cell_60gene, and TNBC_B_Cell are B/plasma cell signatures. T_Cell, T_Cells, T_Cell_cluster, CD8, CD8_cluster, LCK, and TNBC_T-Cell are T-cell signatures, with the CD8 and CD8_cluster signatures specifically representing CD8+ T-cells. MacTh1_cluster, CD68_cluster, Mac_CSF1, and Macrophages are all macrophage/monocyte signatures.
Figure 2.
Figure 2.
Immune gene signature expression by tumor tissue type and Cancer Cluster of Clusters Assignments (COCA) subtypes. Boxplots of expression of IGG_Cluster, CD8, and CD68_cluster gene expression signatures, as well as genes PD-1, PDL-1, and CTLA-4, by tumor tissue type (A, C, E, G, I, K) or COCA subtype (B, D, F, H, J, L) are shown. Statistical significance testing was done using one-way analysis of variance (ANOVA). Expression of immune genes was consistently high in SKCM, HNSC, LUAD, LUSC, and KIRC tumors. ANOVA P values for gene or signature expression by tissue type/COCA group: CD8 P = 5.12E-155/6.26E-169; IGG_Cluster P = 1.01E-238/6.42E-224; CD68_cluster P = 1.09-208/3.77E-199; PD-1 P = 6.46E-97/8.71E-103; PD-L1 P = 1.90E-271/1.11E-279; CTLA-4 P = 4.66E-117/4.85E-127. All statistical tests were two-sided.
Figure 3.
Figure 3.
Correlation of lymphocyte infiltration signatures in tumors. In (A) all samples and (B-L) within samples in each tissue type, Pearson correlations are shown between all immune gene signatures.
Figure 4.
Figure 4.
B-cell receptor (BCR) gene segment expression and pattern of BCR gene segments, where expression was associated with overall survival by tumor type. A) Unsupervised hierarchical clustering of average BCR gene segment expression by tissue type. B) Grid of BCR gene segments, where increased expression was statistically significantly associated with prolonged overall survival (OS; red) and gene segments associated with diminished OS (blue). C) Number of gene segments with statistically significant association with OS by tumor type. Cox proportional hazard models were built using Log10 gene expression for each gene segment. Null distributions were estimated by bootstrap resampling (n = 1000) of 353 random genes and calculating the number where expression was associated with OS. Error bars show the 95% bootstrap confidence interval.
Figure 5.
Figure 5.
B-cell receptor (BCR) variable gene segment expression and diversity by tumor type. BCR V segment sequence diversity (by log10(effective number of species)) vs BCR V segment expression (by log10(read counts)) for all tumor types. In each plot, tumors of a single type are colored in red, with all other tumors colored in gray.
Figure 6.
Figure 6.
Multivariable Cox proportional hazard modeling results for B-cell receptor (BCR) gene segment diversity vs overall survival. Each column indicates one tumor tissue type. CoxPH survival models were fit with BCR variable gene segment expression alone as an explanatory variable (Expression model) and including both expression and diversity as explanatory variables (Expression & Diversity model). Dark gray bars show change in LR χ2 statistic between the Expression model and the null model, and light gray bars show the change in LR χ2 statistic between the Expression model and the Expression & Diversity model (ie, a measure of the extent of increased information included in the latter model). Tumor types in which the Expression & Diversity model provided a statistically significantly better fit than the Expression model alone (P < .05 by LRT) are indicated by *. All statistical tests were two-sided.

Similar articles

Cited by

References

    1. Balch CM, Riley LB, Bae YJ, et al. Patterns of human tumor-infiltrating lymphocytes in 120 human cancers. Arch Surg. 1990;125(2):200–205. - PubMed
    1. Lee S, Margolin K. Tumor-infiltrating lymphocytes in melanoma. Curr Oncol Rep. 2012;14(5):468–474. - PMC - PubMed
    1. Kandalaft LE, Motz GT, Duraiswamy J, et al. Tumor immune surveillance and ovarian cancer: lessons on immune mediated tumor rejection or tolerance. Cancer Metastasis Rev. 2011;30(1):141–151. - PubMed
    1. Anagnostou VK, Brahmer JR. Cancer Immunotherapy: A Future Paradigm Shift in the Treatment of Non-Small Cell Lung Cancer. Clin Cancer Res. 2015;21(5):976–984. - PubMed
    1. Finke JH, Rayman PA, Ko JS, et al. Modification of the tumor microenvironment as a novel target of renal cell carcinoma therapeutics. Cancer J. 2013;19(4):353–364. - PMC - PubMed

Publication types