Multicenter Study
. 2016 Aug 18;128(7):902-10.
doi: 10.1182/blood-2016-02-700054. Epub 2016 Jun 22.

Time-dependent changes in mortality and transformation risk in MDS

Affiliations
Multicenter Study

Time-dependent changes in mortality and transformation risk in MDS

Michael Pfeilstöcker et al. Blood. .

Abstract

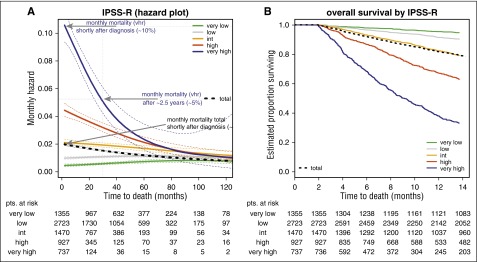
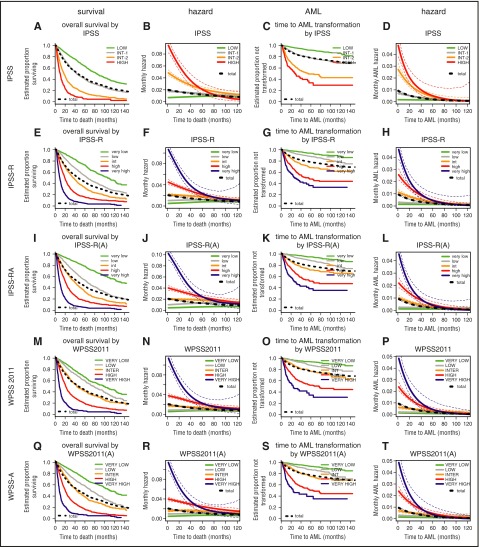
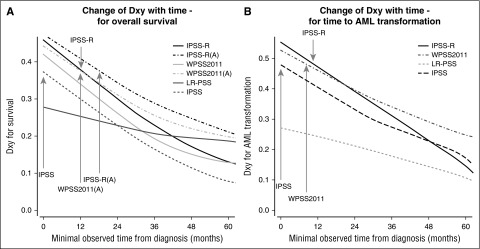
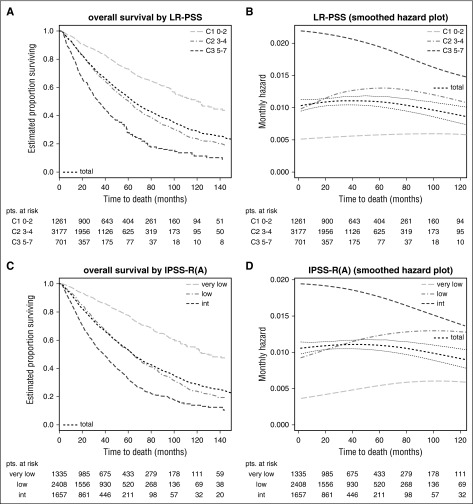
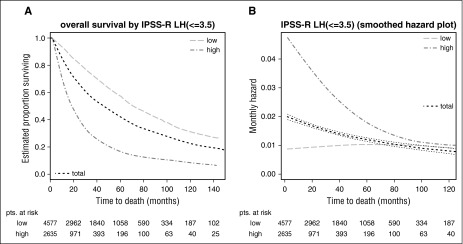
In myelodysplastic syndromes (MDSs), the evolution of risk for disease progression or death has not been systematically investigated despite being crucial for correct interpretation of prognostic risk scores. In a multicenter retrospective study, we described changes in risk over time, the consequences for basal prognostic scores, and their potential clinical implications. Major MDS prognostic risk scoring systems and their constituent individual predictors were analyzed in 7212 primary untreated MDS patients from the International Working Group for Prognosis in MDS database. Changes in risk of mortality and of leukemic transformation over time from diagnosis were described. Hazards regarding mortality and acute myeloid leukemia transformation diminished over time from diagnosis in higher-risk MDS patients, whereas they remained stable in lower-risk patients. After approximately 3.5 years, hazards in the separate risk groups became similar and were essentially equivalent after 5 years. This fact led to loss of prognostic power of different scoring systems considered, which was more pronounced for survival. Inclusion of age resulted in increased initial prognostic power for survival and less attenuation in hazards. If needed for practicability in clinical management, the differing development of risks suggested a reasonable division into lower- and higher-risk MDS based on the IPSS-R at a cutoff of 3.5 points. Our data regarding time-dependent performance of prognostic scores reflect the disparate change of risks in MDS subpopulations. Lower-risk patients at diagnosis remain lower risk whereas initially high-risk patients demonstrate decreasing risk over time. This change of risk should be considered in clinical decision making.


Figures

Figure 1
Figure 1
Survival of IPSS-R–classified patient subgroups using smoothed hazard plots and corresponding Kaplan-Meier curves (representative example). (A) Smoothed hazard plots more clearly demonstrate changes in risk at different time intervals than do (B) Kaplan-Meier plots. The smoothed hazard for very high risk indicates 10% monthly mortality risk in the beginning (A, top arrow) in agreement with the Kaplan-Meier curve. After approximately 30 months (A, middle arrow), 5% monthly mortality for the very-high-risk group is shown, which is not clearly visible in the Kaplan-Meier curve. The mortality risks of the remaining patients for all risk groups are similar after approximately 60 months. Note that the time scale in (B) is expanded to improve visibility of the decline in the first year. The bold black dotted line represents all patients. int, intermediate; pts, patients; vhr, very high-risk.
Figure 2
Figure 2
Comparison of Kaplan-Meier curves and hazard plots for specific risk scoring systems for overall survival (columns 1 and 2) and for time to leukemic transformation (columns 3 and 4). Colors for risk groups are assigned in the order of risk from lowest to highest: green, gray, yellow, red, blue. The bold black dotted line represents all patients. For leukemic transformation, the cause-specific hazard is shown. The curves for time to leukemic transformation correspondingly are based on the cause-specific hazard (and are not cumulative incidence curves). Attenuation of hazards occurred over time after diagnosis in all scoring systems. After approximately 3.5 years, hazards in the separate risk groups became similar and essentially equivalent after 5 years. Note differing time scales for the Kaplan-Meier and hazard plots. A detailed view of individual scores shown in enlarged single figures is available in supplemental Figure 1A-T.
Figure 3
Figure 3
Comparison of change in prognostic power for specific scoring systems. (A) Change of Dxy with time for overall survival, and (B) change of Dxy with time for time to AML transformation (based on WHO-classified patients). The figure demonstrates that nearly all scores lost prognostic power over time, with the relative ranking remaining virtually unchanged. Scores with high initial prognostic power remained prognostically stronger than initially weaker scores. The prognostic power of the IPSS-R after about 9 months and of the IPSS-RA until around 14 months remains as high as that of the original IPSS at diagnosis (gray arrows). Inclusion of patient’s age results in higher initial prognostic power and better stability in predicting survival but not for time to AML progression represented by results from IPSS-RA and WPSS-A versions which included age (panel A).
Figure 4
Figure 4
Stability of scores in lower-risk patients (Kaplan-Meier curves and hazard plots). Overall survival shown by (A,C) Kaplan-Meier curves and (B,D) hazard plots using (A,B) LR-PSS and (C,D) IPSS-RA. The figure demonstrates that scores applied to lower-risk MDS have lower prognostic power but remain more stable over time and are less affected by the attenuation of subgroup-specific hazards (B,D). This is seen for both the LR-PSS and for the IPSS-RA, with both scores restricted to the IPSS-R very-low-/low-/intermediate-risk patients (panels A and C, survival curves). (C-D) An increase of mortality risk related to age is shown. LR-PSS categories: C1, score 0 to 2; C2, score 3 to 4; C3, score 5 to 7. Note differing time scales for the Kaplan-Meier and hazard plots.
Figure 5
Figure 5
Dichotomized separation of lower- vs higher-risk MDS patients in IPSS-R–stratified patients. Kaplan-Meier curves for (A) overall survival and (B) respective hazards plots for patients with an IPSS-R score of ≤3.5 vs >3.5 points which yields the best results regarding prognostic power. Panels A and B show a good separation of patients with initially higher but declining risk vs patients with constant lower risk. Note differing time scales for the Kaplan-Meier and hazard plots.

Comment in

  • Defining risk in MDS over time.
    Yoshimi A, Abdel-Wahab O. Yoshimi A, et al. Blood. 2016 Aug 18;128(7):885-6. doi: 10.1182/blood-2016-07-724930. Blood. 2016. PMID: 27539994 No abstract available.

References

    1. Adès L, Itzykson R, Fenaux P. Myelodysplastic syndromes. Lancet. 2014;383(9936):2239–2252. - PubMed
    1. Pfeilstöcker M. Prognostic Scoring in MDS. In: Varkonyi J, editor. The Myelodysplastic Syndromes. Dordrecht, The Netherlands: Springer; 2011. pp. 103–120.
    1. Pfeilstöcker M, Tüchler H, Schönmetzler A, Nösslinger T, Pittermann E. Time changes in predictive power of established and recently proposed clinical, cytogenetical and comorbidity scores for Myelodysplastic Syndromes. Leuk Res. 2012;36(2):132–139. - PubMed
    1. Malcovati L, Germing U, Kuendgen A, et al. Time-dependent prognostic scoring system for predicting survival and leukemic evolution in myelodysplastic syndromes. J Clin Oncol. 2007;25(23):3503–3510. - PubMed
    1. Garcia-Manero G, Shan J, Faderl S, et al. A prognostic score for patients with lower risk myelodysplastic syndrome. Leukemia. 2008;22(3):538–543. - PubMed

Publication types