. 2016 Sep 8;128(10):1362-73.
doi: 10.1182/blood-2016-02-696757. Epub 2016 Jun 22.

The genetics of nodal marginal zone lymphoma

Affiliations

The genetics of nodal marginal zone lymphoma

Valeria Spina et al. Blood. .

Abstract

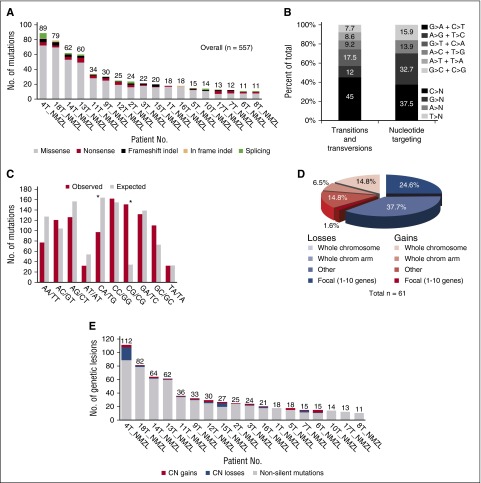
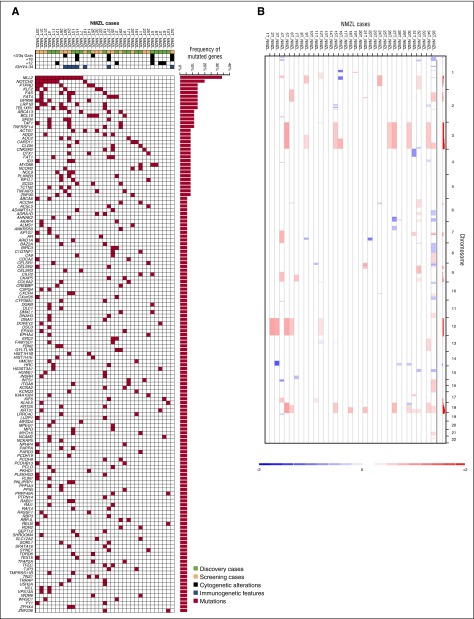
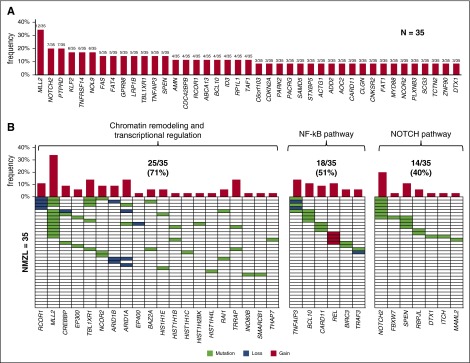
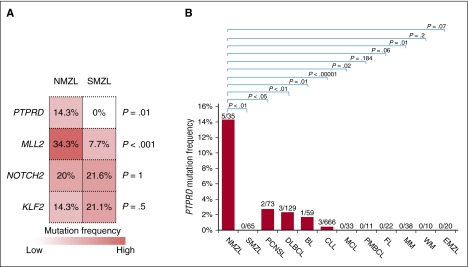
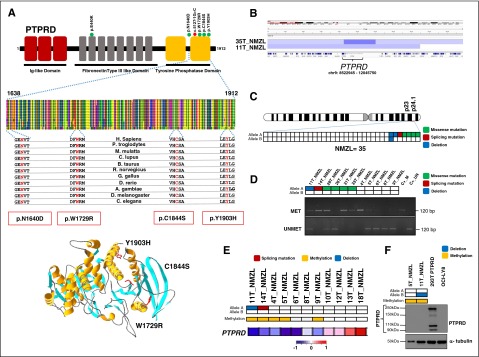
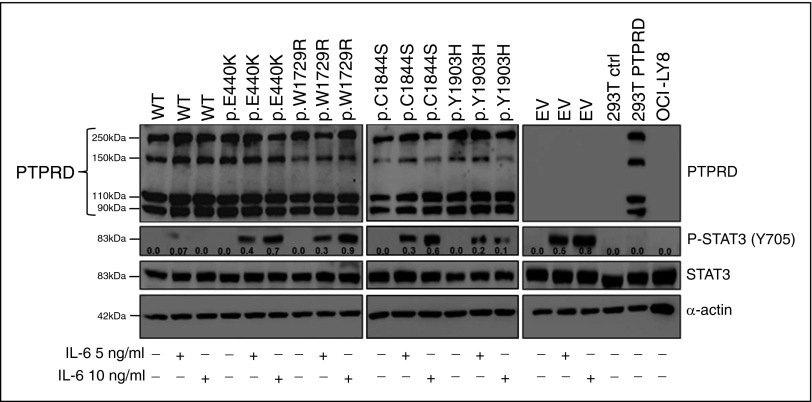
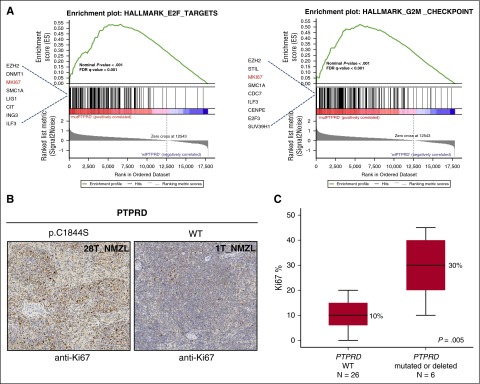
Nodal marginal zone lymphoma (NMZL) is a rare, indolent B-cell tumor that is distinguished from splenic marginal zone lymphoma (SMZL) by the different pattern of dissemination. NMZL still lacks distinct markers and remains orphan of specific cancer gene lesions. By combining whole-exome sequencing, targeted sequencing of tumor-related genes, whole-transcriptome sequencing, and high-resolution single nucleotide polymorphism array analysis, we aimed at disclosing the pathways that are molecularly deregulated in NMZL and we compare the molecular profile of NMZL with that of SMZL. These analyses identified a distinctive pattern of nonsilent somatic lesions in NMZL. In 35 NMZL patients, 41 genes were found recurrently affected in ≥3 (9%) cases, including highly prevalent molecular lesions of MLL2 (also known as KMT2D; 34%), PTPRD (20%), NOTCH2 (20%), and KLF2 (17%). Mutations of PTPRD, a receptor-type protein tyrosine phosphatase regulating cell growth, were enriched in NMZL across mature B-cell tumors, functionally caused the loss of the phosphatase activity of PTPRD, and were associated with cell-cycle transcriptional program deregulation and increased proliferation index in NMZL. Although NMZL shared with SMZL a common mutation profile, NMZL harbored PTPRD lesions that were otherwise absent in SMZL. Collectively, these findings provide new insights into the genetics of NMZL, identify PTPRD lesions as a novel marker for this lymphoma across mature B-cell tumors, and support the distinction of NMZL as an independent clinicopathologic entity within the current lymphoma classification.


Figures

Figure 1
Figure 1
NMZL coding genome complexity. (A) Number and type of nonsilent somatic mutations identified in the 18 discovery genomes. (B) The pattern of nucleotide substitutions in the discovery genomes revealed a predominance of transitions over transversions (296:224, ratio of 1.3) and a preferential targeting of G and C nucleotides (70.2% affecting G/C compared with 29.8% affecting A/T nucleotides). (C) Mutation frequency at specific dinucleotides (red bars). The expected frequencies (gray bars) correspond to the dinucleotide sequence composition of the Consensus CDS. Asterisks denote statistically significant differences in overrepresented changes. (D) Frequency and type of somatically acquired copy number abnormalities (CNAs). (E) Combined load of somatically acquired genetic lesions in the discovery genomes, including nonsilent mutations and CNAs.
Figure 2
Figure 2
Mutated genes and copy number abnormalities in NMZL. (A) Heatmap showing the distribution of mutations in the 142 recurrently mutated genes (>5% of cases) among NMZL of the discovery plus screening cohorts (n = 35). Each row represents a gene and each column represents a primary tumor. Mutations are color coded in red. The horizontal bar graph shows the gene mutation frequency. The plot below the case label indicates sample characteristics (green, discovery cases; yellow, screening cases; blue, immunogenetic features; black, cytogenetic aberrations). (B) Copy number analysis of the NMZL cases. Curated segmentation data for the 35 NMZL samples. In the red-blue scale, white corresponds to a normal (diploid) copy number log ratio, blue is a deletion, and red is a gain.
Figure 3
Figure 3
Genes and pathways that are recurrently affected by genetic lesions in NMZL. (A) Genes (n = 41) that were recurrently affected by mutations and/or focal copy number aberrations in ≥3 of 35 of NMZL. The bar graph represents the frequency of molecular lesions in each gene. (B) Molecularly deregulated pathways in NMZL. In the heatmap, rows correspond to genes and columns represent individual patients. Color coding is based on gene alteration status (white, wild-type; green, mutated; blue, loss; red, gain). The bar graph represents the frequency of molecular lesions in each gene. The overall frequency of genetic lesions in each pathway is indicated.
Figure 4
Figure 4
PTPRD mutations are enriched in NMZL among mature B-cell tumors. (A) The heatmap represents the frequency of mutations in the top genes that are affected in at least 15% cases of NMZL and/or SMZL. P values from the comparison of the mutation frequency in NMZL vs SMZL by Bonferroni corrected Fisher exact test. (B). Prevalence of nonsynonymous PTPRD mutations among mature B-cell tumors (NMZL, nodal marginal zone lymphoma, data from this study; SMZL, splenic marginal zone lymphoma, data from this study and others,,,; DLBCL, diffuse large B-cell lymphoma, data from various studies,,,; BL, Burkitt lymphoma, data from various studies,; CLL, chronic lymphocytic leukemia, data from various studies,,,; MCL, mantle cell lymphoma, data from Beà et al; PMBCL, primary mediastinal large B-cell lymphoma, data from Gunawardana et al; FL, follicular lymphoma, data from various studies,; MM, multiple myeloma, data from Chapman et al; WM, Waldenström macroglobulinemia, data from various studies,; EMZL, extranodal marginal zone lymphoma, data from this study; PCNSL primary central nervous system lymphoma, data from various studies-).
Figure 5
Figure 5
PTPRD mutations in NMZL. (A) Schematic diagram of the PTPRD protein with its key functional domains (top). Color-coded symbols indicate the type and position of the mutations on the PTPRD protein (green, missense mutations; red, splicing site mutation). Multiple alignment of the PTPRD phosphatase domain amino acid sequences with the 11 orthologous PTPRD proteins. Conserved amino acids affected by mutations are color coded in red. Representation of the 3D structure of the PTPRD phosphatase domain mutations (bottom). The structural view of the PTPRD phosphatase domain was generated in DeepView-Swiss-PdbViewer (http://spdbv.vital-it.ch/) using the coordinates of the crystal structure of the PTPRS phosphatase domain (99% identity with PTPRD) (PDB 2fh7). Residues targeted by somatic mutations in NMZL are highlighted. (B) Graphic representation of segmentation data from 2 NMZL cases harboring PTPRD copy number losses visualized with Integrative Genomics Viewer (IGV) software. Each track represents one sample, where blue indicates region of a copy number loss. Individual genes in the region are aligned in the bottom panel. (C) Allelic (A or B) distribution of PTPRD genetic lesions in individual NMZL cases (green, missense mutation; red, splicing mutation; blue, deletion). (D) Methylation-specific PCR documenting aberrant methylation of the PTPRD-promoter CpG sites in NMZL cases (MET, methylated sample; UNMET, unmethylated sample; C+_M, positive control of methylated reaction; C+_UN, positive control of unmethylated reaction; bp, base pair). In the heatmap, rows correspond to the allelic status of PTPRD gene in NMZL (white, wild-type; green, mutated; blue, deleted). (E) Transcriptome analysis of PTPRD expression in primary NMZL. In the heatmaps, the first 2 rows correspond to the allelic status of the PTPRD gene in NMZL (white, wild-type; green, mutated; blue, deleted), the third row shows the methylation status of PTPRD (white, unmethylated; yellow, methylated), the last row shows the expression of PTPRD in NMZL (red, high expression; blue, low expression). (F) Western blot analysis of PTPRD protein expression in primary NMZL samples. The HEK 293T cells tranfected with a vector containing the wild-type PTPRD tagged with GFP at the C-terminal were used as positive control. The OCI-LY8 cells harboring a biallelic deletion of PTPRD were used as negative control. In the positive control, western blot analysis shows the GFP-tagged full-length PTPRD protein (250 kDa), as well as 2 N-terminal PTPRD protein products (150 kDa and 90k Da), and a GFP-tagged C-terminal PTPRD product (110 kDa) after cleavage process by a physiologic posttranslational modification called ectodomain shedding α-tubulin was used as a loading control. In the heatmaps, the first 2 rows correspond to the allelic status of PTPRD gene in NMZL (white, wild-type; blue, deleted), and the third row shows the methylation status of PTPRD (white, unmethylated; yellow, methylated).
Figure 6
Figure 6
Mutations impair the tyrosine phosphatase activity of PTPRD. Expression of the STAT3 protein and of the phosphorylated STAT3 protein (pSTAT3, Y705) in HEK 293 cells transfected with constructs expressing wild-type PTPRD-GFP (WT), mutant PTPRD-GFP, or empty vector (EV). Nontransfected HEK 293T cells (293T ctrl) and OCI-LY8 were used as negative control for PTPRD expression. The HEK 293T cells transfected with a vector containing the wild-type PTPRD tagged with GFP at the C-terminal were used as positive control for PTPRD expression (western blot shows the GFP-tagged full-length PTPRD protein [250 kDa], as well as 2 N-terminal PTPRD protein products [150 kDa and 90 kDa], and a GFP-tagged C-terminal PTPRD product [110 kDa] after cleavage process by a physiologic posttranslational modification called ectodomain shedding). Protein lysates were prepared from cell cultures treated with or without 5 or 10 ng/mL human interleukin-6 (IL-6). Relative densitometric values of the phosphorylated STAT3 protein (pSTAT3, Y705) (shown for each band) were normalized against the levels of the internal loading control (α-actin).
Figure 7
Figure 7
Primary NMZL cases harboring PTPRD lesions show a cell-cycle signature and an increased proliferation index. (A) GSEA plot illustrating the enrichment and upregulation of different biologically relevant gene sets (E2F pathway and G2M cell-cycle checkpoints) in PTPRD mutated/deleted vs PTPRD wild-type. Genes with an enrichment score <0.1 are shown. GSEA, Gene Set Enrichment Analysis; FDR, false discovery rate. (B) Ki-67 expression by immunohistochemical analysis of the lymph node biopsy from one exemplificative PTPRD-mutated NMZL case and one exemplificative PTPRD wild-type case (original magnification ×10). (C) Comparison of the Ki-67 proliferation index assessed by immunohistochemistry between PTPRD-mutated/deleted cases vs PTPRD wild-type NMZL (median, black line inside the bar; quartiles, margin of the box; range, whiskers). P value by Mann-Whitney U test.

Comment in

References

    1. Swerdlow SH, Campo E, Harris NL, et al. Lyon, France: IARC; 2008. World Health Organization Classification of Tumours, Pathology and Genetics of Tumours of Haematopoietic and Lymphoid Tissues.
    1. Falini B, Agostinelli C, Bigerna B, et al. IRTA1 is selectively expressed in nodal and extranodal marginal zone lymphomas. Histopathology. 2012;61(5):930–941. - PubMed
    1. Falini B, Tiacci E, Pucciarini A, et al. Expression of the IRTA1 receptor identifies intraepithelial and subepithelial marginal zone B cells of the mucosa-associated lymphoid tissue (MALT). Blood. 2003;102(10):3684–3692. - PubMed
    1. Thieblemont C, Davi F, Noguera ME, Brière J. Non-MALT marginal zone lymphoma. Curr Opin Hematol. 2011;18(4):273–279. - PubMed
    1. Rossi D, Trifonov V, Fangazio M, et al. The coding genome of splenic marginal zone lymphoma: activation of NOTCH2 and other pathways regulating marginal zone development. J Exp Med. 2012;209(9):1537–1551. - PMC - PubMed

Publication types

MeSH terms

Substances