. 2016 Jun;6(6):160038.
doi: 10.1098/rsob.160038.

Systematic tracking of altered haematopoiesis during sporozoite-mediated malaria development reveals multiple response points

Affiliations

Systematic tracking of altered haematopoiesis during sporozoite-mediated malaria development reveals multiple response points

Maria L Vainieri et al. Open Biol. 2016 Jun.

Abstract

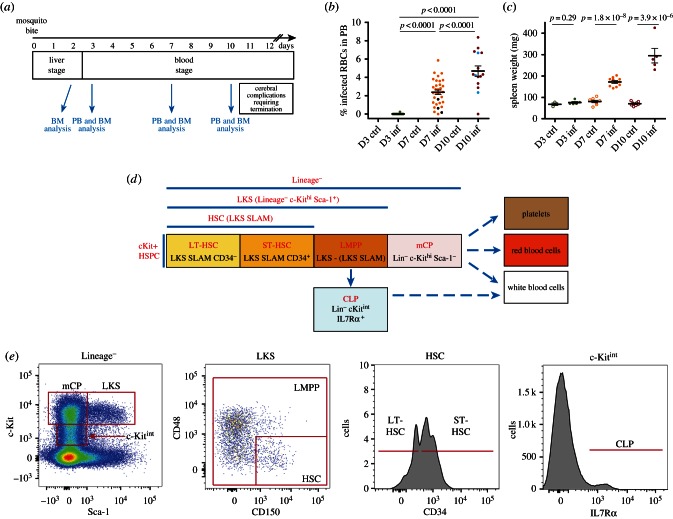
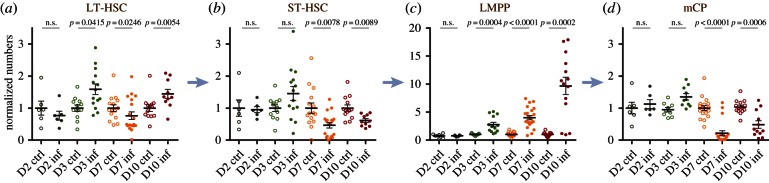
Haematopoiesis is the complex developmental process that maintains the turnover of all blood cell lineages. It critically depends on the correct functioning of rare, quiescent haematopoietic stem cells (HSCs) and more numerous, HSC-derived, highly proliferative and differentiating haematopoietic progenitor cells (HPCs). Infection is known to affect HSCs, with severe and chronic inflammatory stimuli leading to stem cell pool depletion, while acute, non-lethal infections exert transient and even potentiating effects. Both whether this paradigm applies to all infections and whether the HSC response is the dominant driver of the changes observed during stressed haematopoiesis remain open questions. We use a mouse model of malaria, based on natural, sporozoite-driven Plasmodium berghei infection, as an experimental platform to gain a global view of haematopoietic perturbations during infection progression. We observe coordinated responses by the most primitive HSCs and multiple HPCs, some starting before blood parasitaemia is detected. We show that, despite highly variable inter-host responses, primitive HSCs become highly proliferative, but mathematical modelling suggests that this alone is not sufficient to significantly impact the whole haematopoietic cascade. We observe that the dramatic expansion of Sca-1(+) progenitors results from combined proliferation of direct HSC progeny and phenotypic changes in downstream populations. We observe that the simultaneous perturbation of HSC/HPC population dynamics is coupled with early signs of anaemia onset. Our data uncover a complex relationship between Plasmodium and its host's haematopoiesis and raise the question whether the variable responses observed may affect the outcome of the infection itself and its long-term consequences on the host.

Keywords: haematopoietic stem cells; plasmodium infection; population dynamics.


Figures

Figure 1.
Figure 1.
Analysis of the haematopoietic response to sporozoite P. berghei infection. (a) Timeline of P. berghei-induced malaria onset and time point analysed. On day 0, cohorts of C57/B6 mice were exposed to bites by control or P. berghei-infected A. stephensi mosquitoes. On days 3, 7 and 10 psi, groups of 2–3 control and 3–5 infected mice were culled and their peripheral blood (PB) and bone marrow (BM) cells analysed. Boxes indicate the duration of liver/blood stages of disease and the time of onset of cerebral complications. In this study, we analysed animals from a total of six independent infections. (b) Parasitaemia detected at days 3, 7 and 10 psi. p-Values are not shown but all <0.005 for each pairwise comparison. Black dots in the day 7 pool and light blue dots in the day 10 pool indicate mice that, despite showing parasitaemia, did not mount a dramatic haematopoietic response. n = 20 mice culled and analysed at day 3, 32 at day 7 and 15 at day 10 psi, pooled from six independent infections. (c) Spleen weight for control and infected mice at the times indicated. n = 5 mice culled and analysed at day 3, 10 at day 7 and 5 at day 10 psi, pooled from three independent infections. (d) Schematic of the haematopoietic stem and progenitor cell populations analysed, including phenotypic markers and nomenclature used throughout the manuscript. HSC, haematopoietic stem cells (LT, long-term, ST, short-term repopulating); LMPP, lymphoid and myeloid multipotent progenitors; mCP, myeloid committed progenitors; CLP, common lymphoid progenitors; LKS, LineageKithiSca+; SLAM: CD150+CD48. (e) Gates used to identify the cell populations in (d) using flow cytometry analysis. Above each plot is indicated the population shown, and boxes indicate how subpopulations were identified based on the expression levels of cell surface markers.
Figure 2.
Figure 2.
Changes in HSPC populations during malaria onset. Each dot plot shows data collected from each control/infected mouse analysed at the days psi indicated. Arrows indicate the hierarchical relationship between the cell populations analysed. (a) LT-HSC numbers, n = 4, 12, 15, 13 control and 6, 14, 19, 10 infected mice culled and analysed at days 2, 3, 7 and 10 psi, respectively, pooled from six independent infections. (b) ST-HSC numbers, n = 4, 12, 15, 13 control and 6, 14, 19, 10 infected mice culled and analysed at days 2, 3, 7 and 10 psi respectively, pooled from six independent infections. (c) LMPP numbers, n = 4, 11, 21, 17 control and 6, 13, 22, 14 infected mice culled and analysed at days 2, 3, 7 and 10 psi, respectively, pooled from seven independent infections. (d) mCP numbers, n = 4, 12, 21, 17 control and 6, 13, 23, 14 infected mice culled and analysed at days 2, 3, 7 and 10 psi, respectively, pooled from seven independent infections. p-Values for comparison between infected and control values each day are as indicated. n.s., not significant (p > 0.05).
Figure 3.
Figure 3.
HSC and HSC subpopulations: proliferation and apoptosis during sporozoite P. berghei infection. (ac) Percentage of BrdU+ cells in LT-HSC (a), ST-HSC (b) and the overall HSC (c) populations analysed in control and infected mice at days 2, 3, 7 and 10 psi. n = 4, 7, 10, 7 control and 6, 10, 10, 6 infected mice analysed at days 2, 3, 7 and 10 psi, respectively, in (a); 4, 7, 10, 7 control and 6, 10, 9, 5 infected mice analysed at days 2, 3, 7 and 10 psi, respectively, in (b); and 11, 14, 10 control and 14, 15, 10 infected mice analysed at days 3, 7 and 10 psi, respectively, in (c). Data are pooled from three to six independent infections. (df) percentage of AnnexinV+7AAD apoptotic cells in LT-HSC (d), ST-HSC (e) and the overall HSC (f) populations analysed in control and infected mice at days 3, 7 and 10 psi. n = 11, 16, 13 control and 15, 19, 10 infected mice analysed at days 3, 7 and 10 psi, respectively, in (d); 12, 13, 13 control and 14, 15, 10 infected mice analysed at days 3, 7 and 10 psi, respectively, in (e) and 12, 18, 13 control and 14, 19, 10 infected mice analysed at days 3, 7 and 10 psi, respectively, in (f). Data are pooled from three to five independent infections. p-Values for comparison between infected and control values each day are as indicated. n.s., not significant (p > 0.05).
Figure 4.
Figure 4.
Proliferation and apoptosis of multipotent and myeloid committed haematopoietic progenitor populations in response to sporozoite P. berghei infection. (a,b) Percentage of BrdU + LMPP (a) and mCP (b) populations in control and infected mice analysed at days 2, 3, 7 and 10 psi. n = 4, 11, 8, 9 control and 6, 14, 10, 9 infected mice analysed at days 2, 3, 7 and 10 psi, respectively, in (a); 4, 11, 11, 9 control and 6, 14, 10, 9 infected mice analysed at days 2, 3, 7 and 10 psi, respectively, in (b). Data pooled from five independent infections. (c,d) Percentage of percentage of AnnexinV+7AAD apoptotic cells in LMPP (c) and mCP (d) populations. n = 12, 13, 13 control and 14, 14, 10 infected mice analysed at days 3, 7 and 10 psi, respectively. Data pooled from four independent infections. p-Values for comparison between infected and control values each day are as indicated. n.s., not significant (p > 0.05).
Figure 5.
Figure 5.
The increased LKS population results from proliferation of HSCs and LMPPs and upregulation of Sca-1 by a proportion of mCPs. (a) Representative plots showing the changing pattern in Sca-1 and c-Kit expression in undifferentiated, Lineage bone marrow haematopoietic cells. Boxes indicate the mCP and LKS gates. (b) Predicted (dotted lines) and measured (solid lines) changes in the average number of LKS (i) and mCP (ii) cells from day 3 to day 7 based on the proliferation and apoptosis data and assumptions described in the main text. Asterisks indicate: (i) the amount of LKS cells not accounted for by proliferation and (ii) the same amount of mCP cells that may have upregulated Sca-1 and fallen within the measured LKS population. The cross symbol marks the proportion of mCPs lost from day 3 to day 7. (c) Representative plots showing CD16/32 and CD34 in LKS and Linc-Kit+Sca-1 cells during the course of sporozoite P. berghei infection. (a,c) n ≥ 30 control, >15 day 3, >20 day 7 and >13 day 10 mice from four independent infections.
Figure 6.
Figure 6.
Mathematical model testing the impact of changes in proliferation and differentiation of HSCs alone and HSC + haematopoietic progenitor cell populations combined on downstream haematopoiesis. (a) Schematic of the model used, which includes a stem cell population ‘S’, an intermediate progenitor population ‘P’, and differentiated progeny of red (R) and white (W) blood cells, and their respective fates (grey arrows). Cells within the S and P population proliferate at a rate αS and αP and differentiate S into P at rate βS and P into R and W at rates βPR and βPW. The only fate of R and W cells is death. Feedback mechanisms from R and W onto P and from P onto S avoid unbound growth (dotted arrows). (b) Diagrammatic representations of the result of altering dynamics of the S population alone (1) or of S and P simultaneously (2). In (1), αS and βS grow equally, but this has no effect on the overall haematopoietic dynamics. In (2), both αS and βS and αP and βPR/βPW pairs undergo balanced increase, resulting in haematopoietic perturbations.
Figure 7.
Figure 7.
Dynamics of overall bone marrow and peripheral blood populations during sporozoite P. berghei infection and onset of a pre-anaemic stage. (a,b) Peripheral blood white (a) and red (b) cell counts in control and infected animals at the indicated days psi. n = 13, 19, 9 control and 14, 23, 10 infected mice analysed at days 3, 7 and 10 psi, respectively, in (a); 13, 16, 9 control and 14, 18, 10 infected mice analysed at days 3, 7 and 10 psi, respectively, in (b). Data pooled from four independent infections. (c) Frequency of reticulocytes in peripheral blood, expressed as a percentage of overall red blood cells analysed. n = 13, 19, 12 control and 15, 24, 10 infected mice analysed at days 3, 7 and 10 psi, respectively. Data pooled from five independent infections. (d) Total bone marrow cellularity of control and infected mice analysed at days 3, 7 and 10 psi. n = 13, 16, 11 control and 15, 19 and 10 infected mice. (e,f) Bone marrow cell counts for erythrocytes (Ter119+) and stem/progenitor/white overall cell population (Ter119–). n = 13, 21, 11 control and 15, 24, 10 infected mice analysed at days 3, 7 and 10 psi, respectively. (g) Normalized counts for cells at stages I, II, II, IV and V or erythroid differentiation in the bone marrow of control and infected mice at days 3, 7 and 10 psi. n = 5, 9, 7 control and 5, 14, 6 infected mice. Data pooled from three independent infections. p-Values for comparison between infected and control values each day are: *p < 0.05; ***p < 0.005, otherwise not significant.

References

    1. Wilson A, et al. 2008. Hematopoietic stem cells reversibly switch from dormancy to self-renewal during homeostasis and repair. Cell 135, 1118–1129. (doi:10.1016/j.cell.2008.10.048) - DOI - PubMed
    1. Gordon MY, Lewis JL, Marley SB. 2002. Of mice and men…and elephants. Blood 100, 4679–4680. (doi:10.1182/blood-2002-08-2517) - DOI - PubMed
    1. King KY, Goodell MA. 2011. Inflammatory modulation of HSCs: viewing the HSC as a foundation for the immune response. Nat. Rev. Immunol. 11, 685–692. (doi:10.1038/nri3062) - DOI - PMC - PubMed
    1. Mirantes C, Passegue E, Pietras EM. 2014. Pro-inflammatory cytokines: emerging players regulating HSC function in normal and diseased hematopoiesis. Exp. Cell Res. 329, 248–254. (doi:10.1016/j.yexcr.2014.08.017) - DOI - PMC - PubMed
    1. Baldridge MT, King KY, Goodell MA. 2011. Inflammatory signals regulate hematopoietic stem cells. Trends Immunol. 32, 57–65. (doi:10.1016/j.it.2010.12.003) - DOI - PMC - PubMed

Publication types