. 2016 Jun 22;36(25):6742-57.
doi: 10.1523/JNEUROSCI.0011-16.2016.

Synapsin Isoforms Regulating GABA Release from Hippocampal Interneurons

Affiliations

Synapsin Isoforms Regulating GABA Release from Hippocampal Interneurons

Sang-Ho Song et al. J Neurosci. .

Abstract

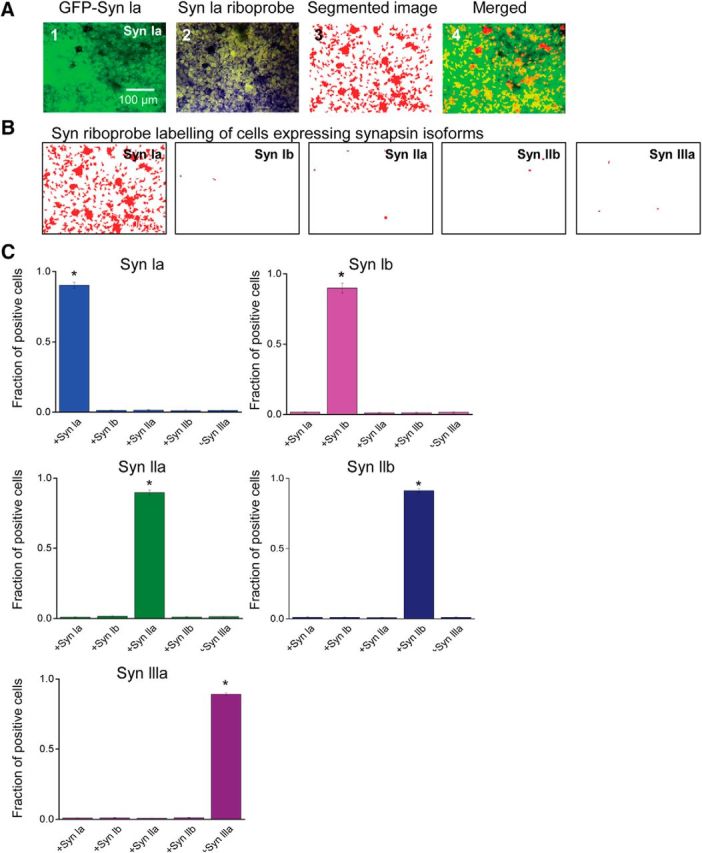
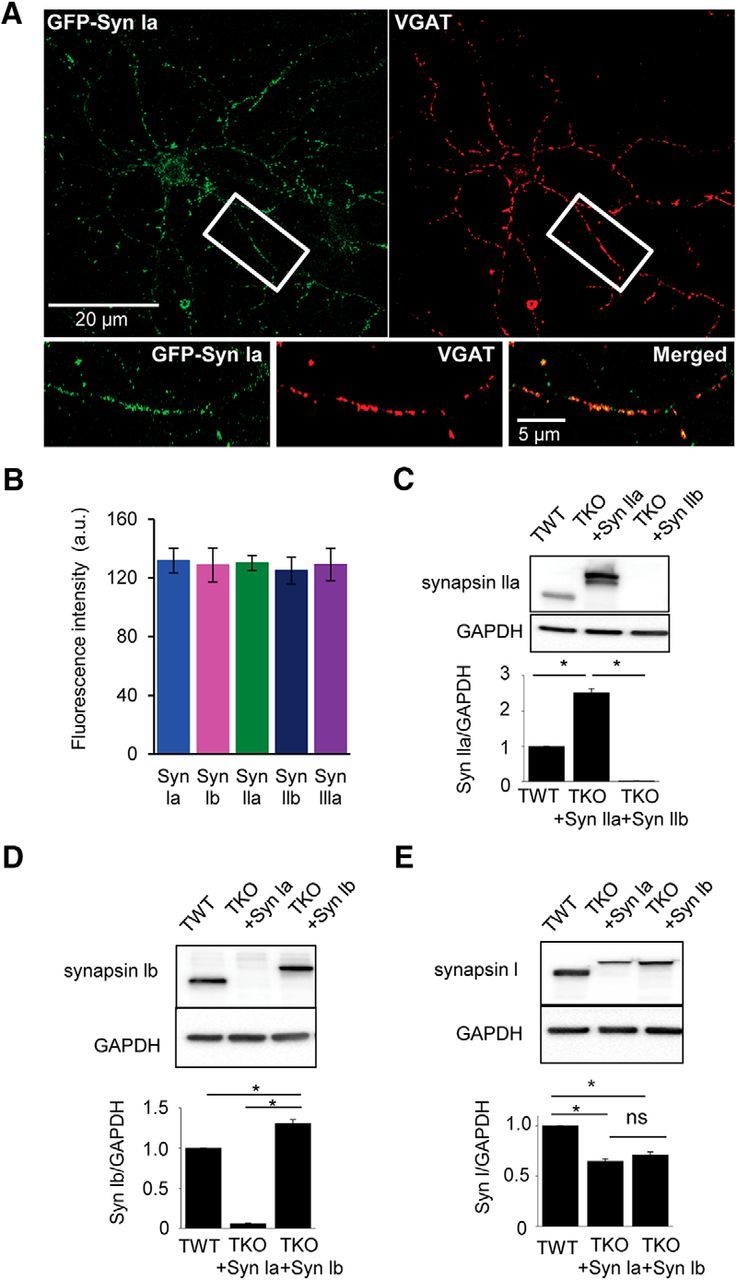
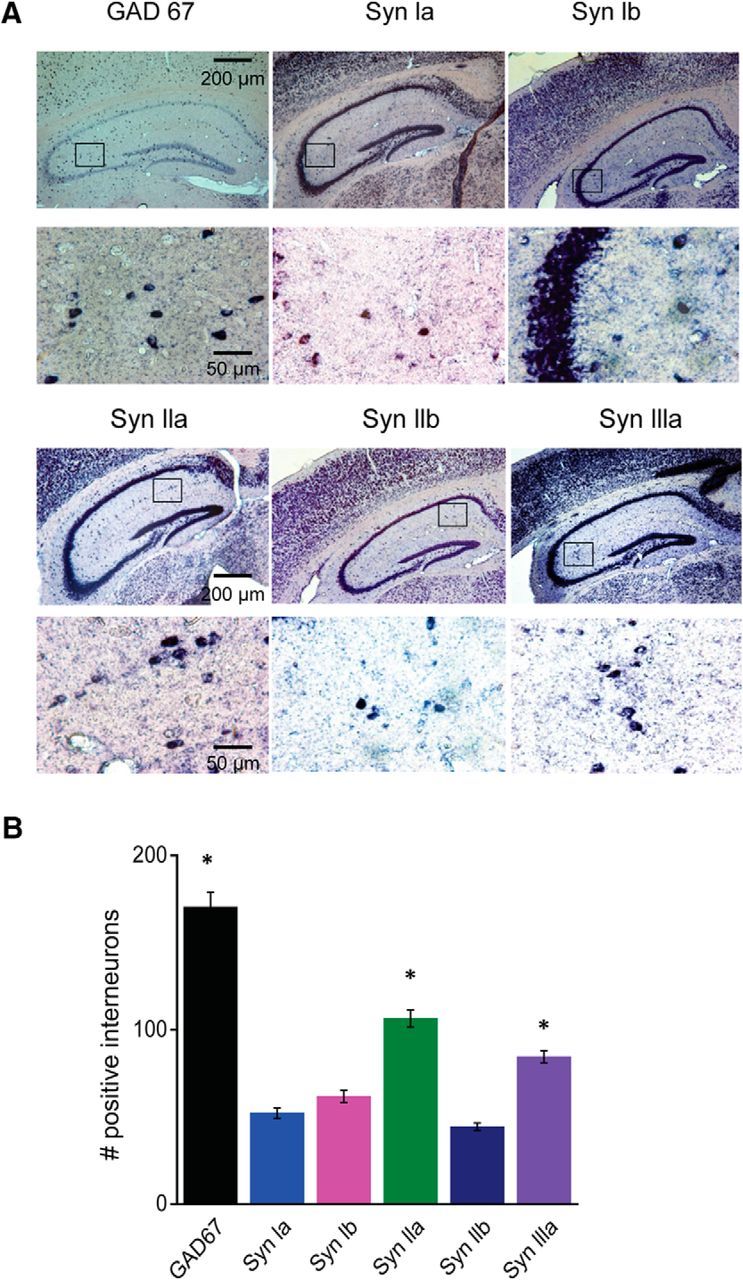
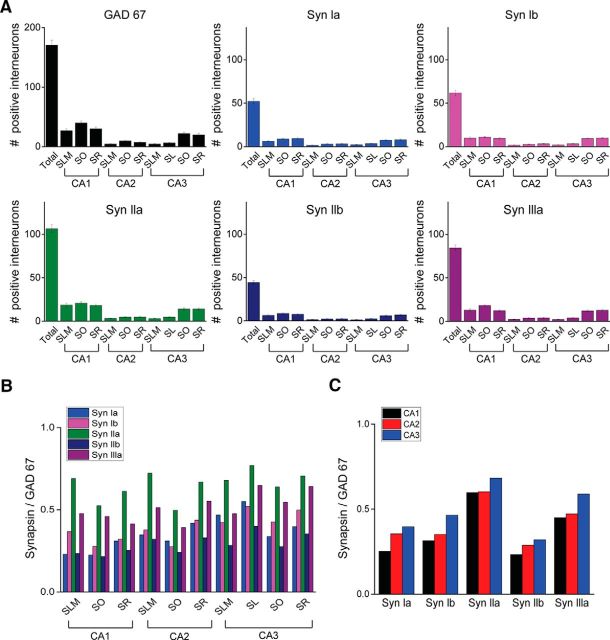
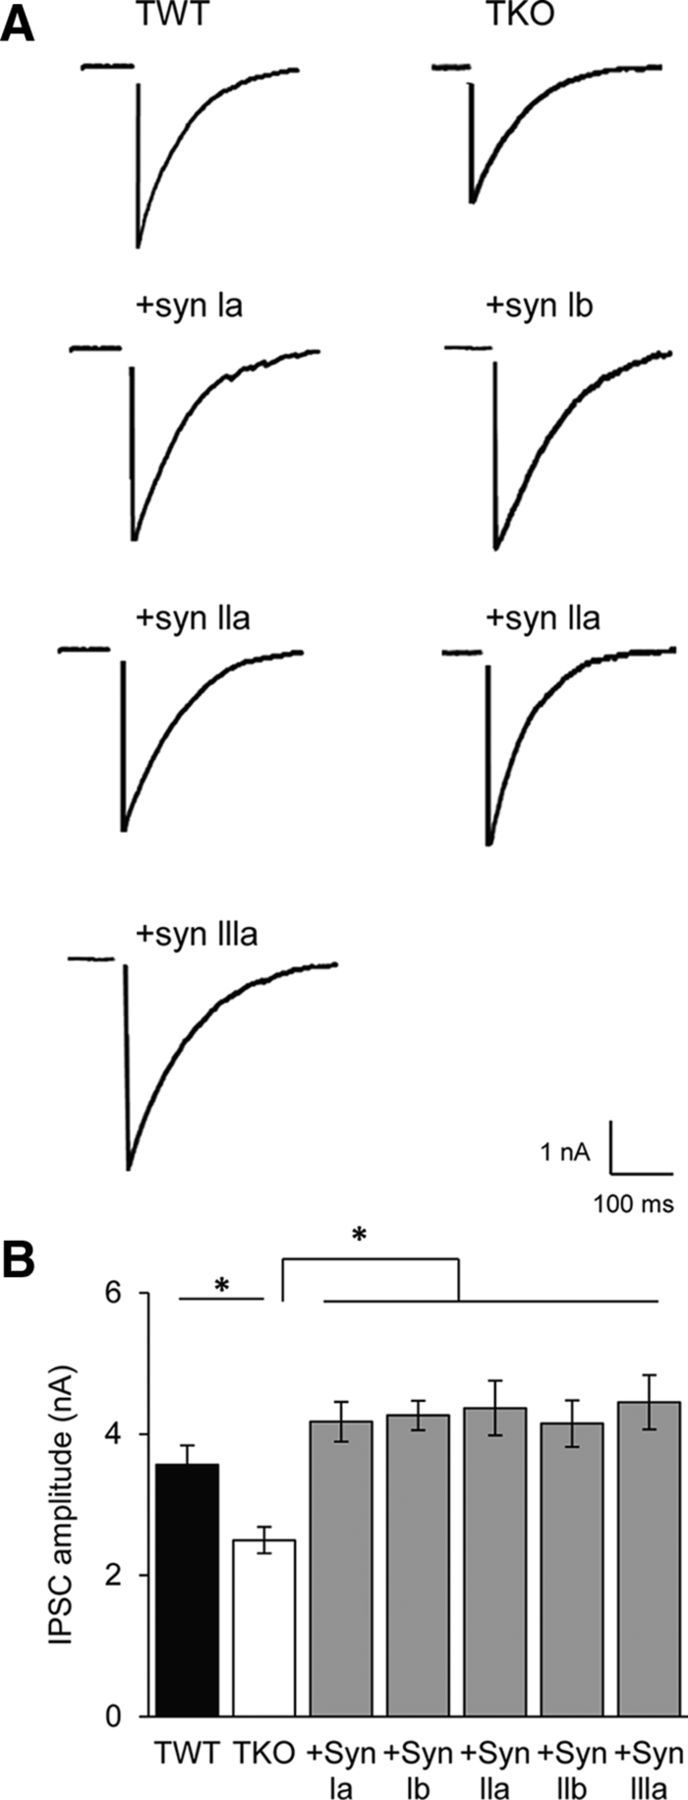
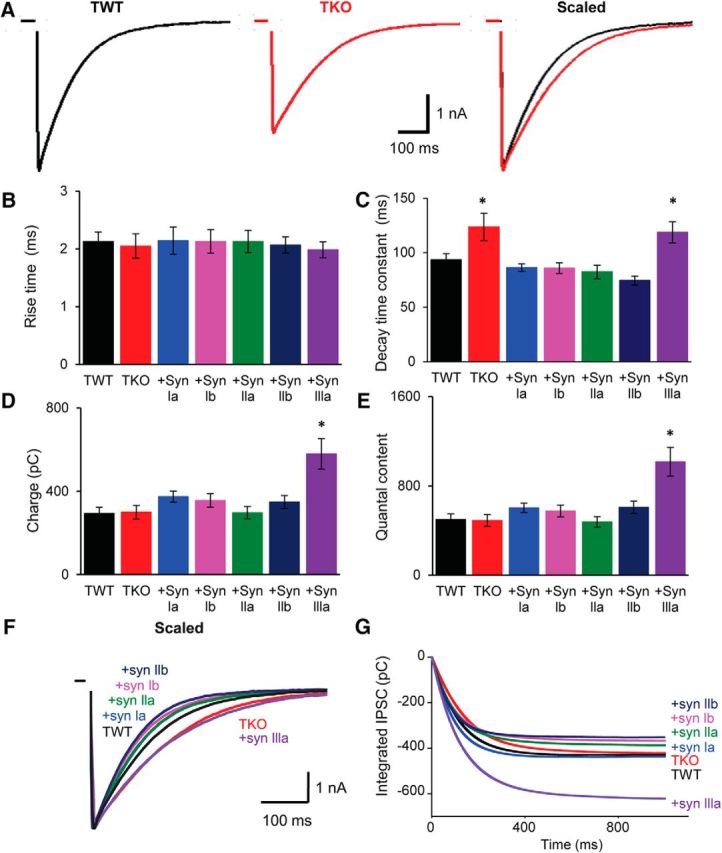
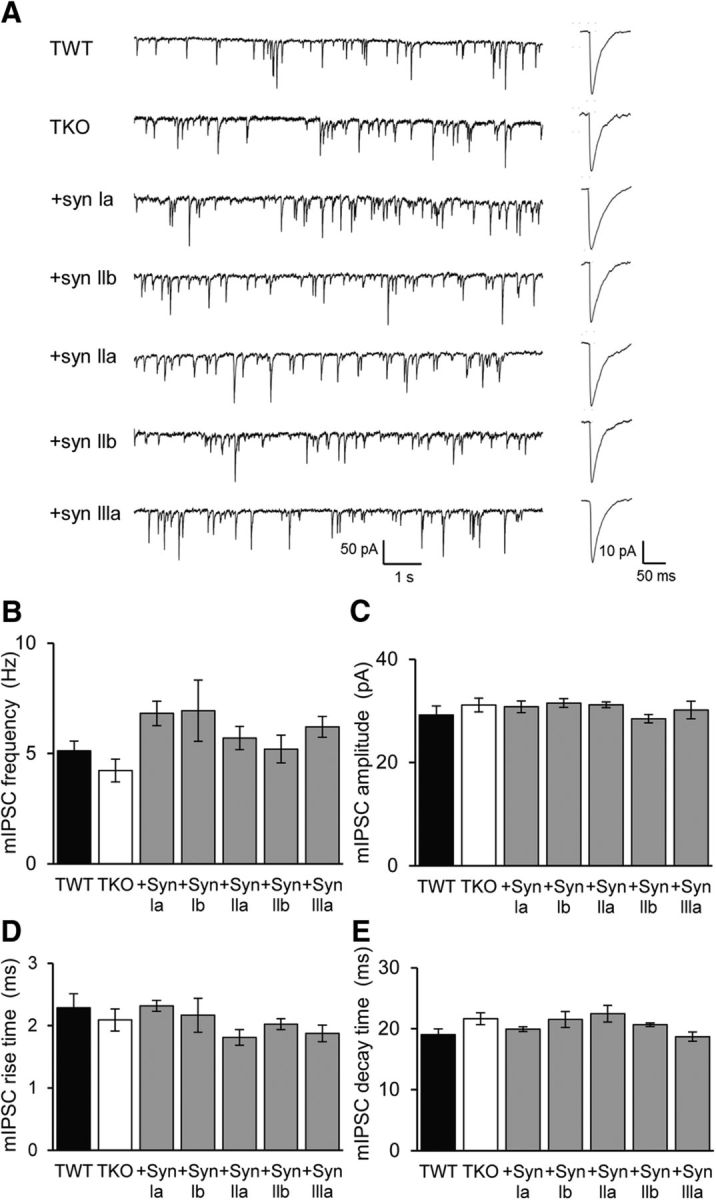
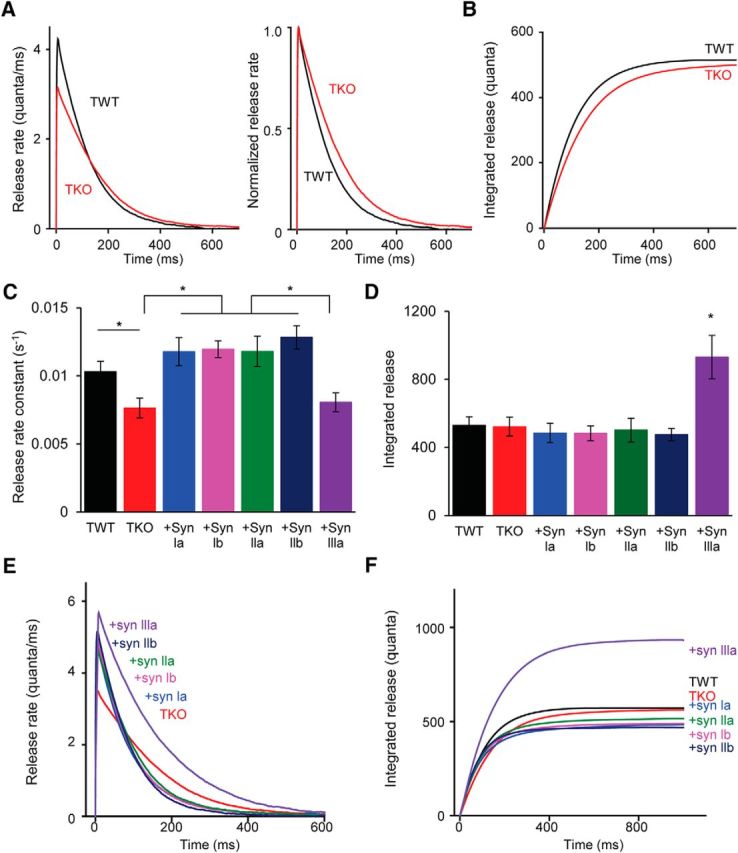
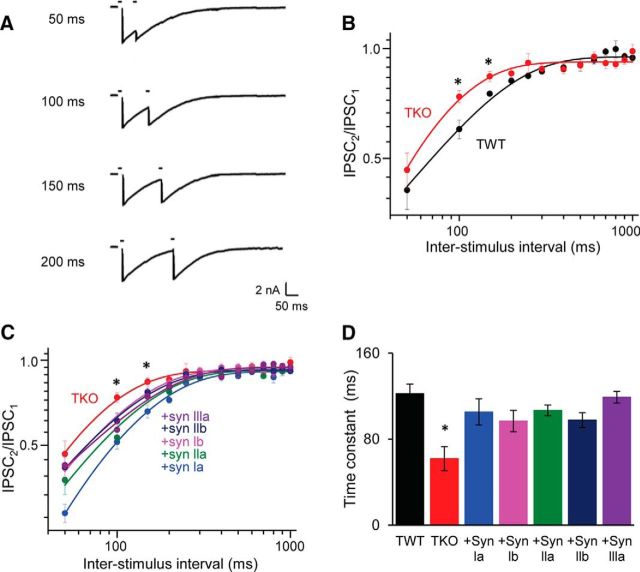
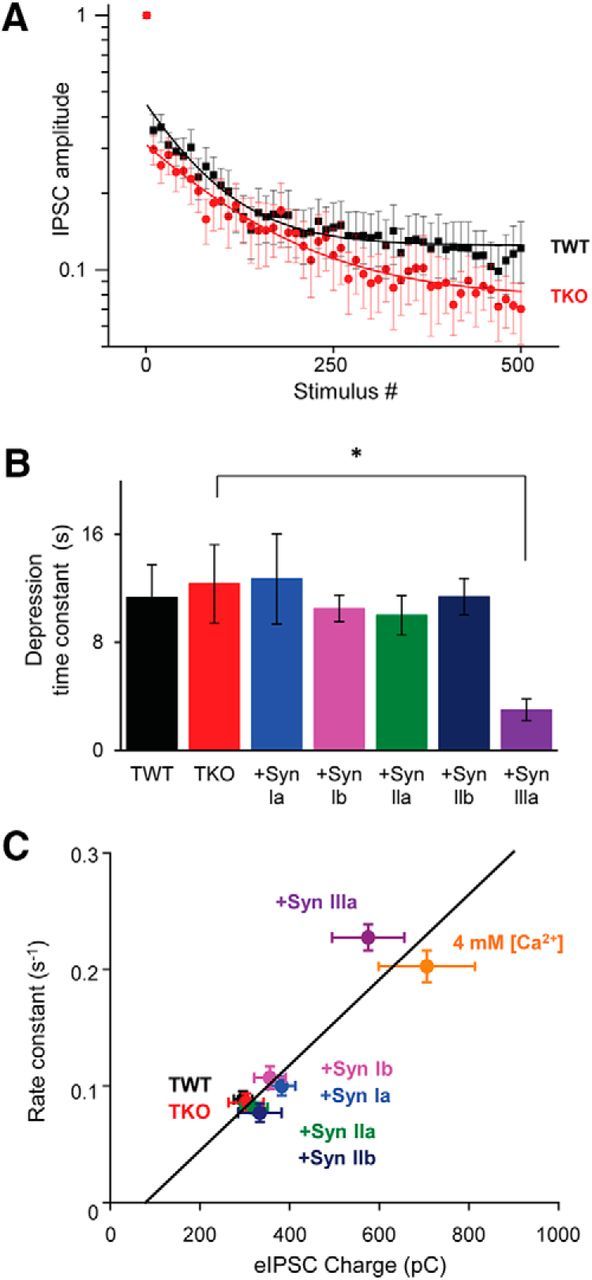
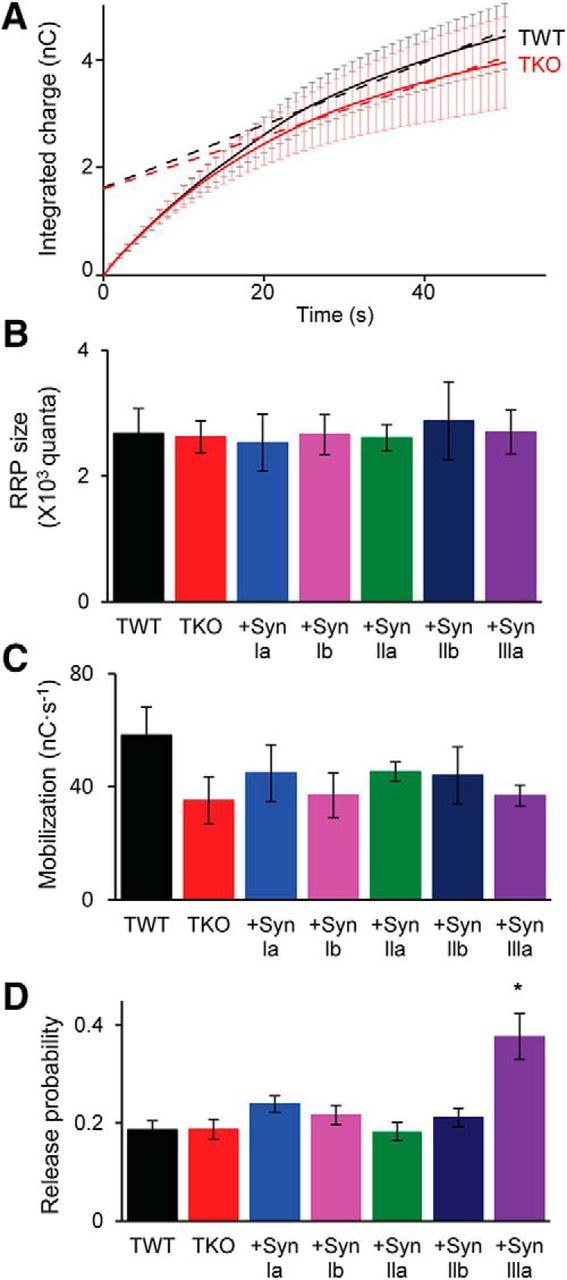
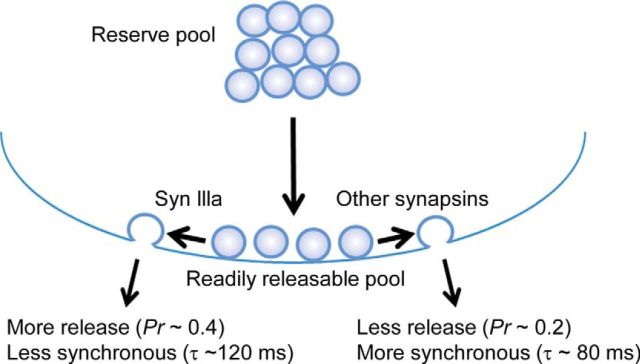
Although synapsins regulate GABA release, it is unclear which synapsin isoforms are involved. We identified the synapsin isoforms that regulate GABA release via rescue experiments in cultured hippocampal neurons from synapsin I, II, and III triple knock-out (TKO) mice. In situ hybridization indicated that five different synapsin isoforms are expressed in hippocampal interneurons. Evoked IPSC amplitude was reduced in TKO neurons compared with triple wild-type neurons and was rescued by introducing any of the five synapsin isoforms. This contrasts with hippocampal glutamatergic terminals, where only synapsin IIa rescues the TKO phenotype. Deconvolution analysis indicated that the duration of GABA release was prolonged in TKO neurons and this defect in release kinetics was rescued by each synapsin isoform, aside from synapsin IIIa. Because release kinetics remained slow, whereas peak release rate was rescued, there was a 2-fold increase in GABA release in TKO neurons expressing synapsin IIIa. TKO neurons expressing individual synapsin isoforms showed normal depression kinetics aside from more rapid depression in neurons expressing synapsin IIIa. Measurements of the cumulative amount of GABA released during repetitive stimulation revealed that the rate of mobilization of vesicles from the reserve pool to the readily releasable pool and the size of the readily releasable pool of GABAergic vesicles were unaffected by synapsins. Instead, synapsins regulate release of GABA from the readily releasable pool, with all isoforms aside from synapsin IIIa controlling release synchrony. These results indicate that synapsins play fundamentally distinct roles at different types of presynaptic terminals.

Significance statement: Synapsins are a family of proteins that regulate synaptic vesicle (SV) trafficking within nerve terminals. Here, we demonstrate that release of the inhibitory neurotransmitter GABA is supported by many different synapsin types. This contrasts with the release of other neurotransmitters, which typically is supported by only one type of synapsin. We also found that synapsins serve to synchronize the release of GABA in response to presynaptic action potentials, which is different from the synapsin-dependent trafficking of SVs in other nerve terminals. Our results establish that different synapsins play fundamentally different roles at nerve terminals releasing different types of neurotransmitters. This is an important clue to understanding how neurons release their neurotransmitters, a process essential for normal brain function.

Keywords: GABA; exocytosis; hippocampus; interneurons; synapsin; synaptic vesicle trafficking.


Figures

Figure 1.
Figure 1.
Specificity of riboprobes for ISH. A, Detection of labeling. A1, Expression of GFP-tagged synapsin Ia in HEK 293T cells. A2, ISH (blue color) with the synapsin Ia riboprobe for the same field shown in A1. A3, Image shown in A2 was segmented (orange) by using intensity and area thresholds to define locations where ISH occurs. Segmented image from A3 was merged with the fluorescence image from A1, revealing that ISH occurred in nuclei of cells expressing synapsin Ia. B, A synapsin Ia riboprobe was used to probe HEK cells expressing the indicated synapsin isoforms and segmented images, as in A3, were used to visualize ISH. Only cells expressing synapsin Ia exhibited appreciable ISH, demonstrating the specificity of the synapsin Ia probe. C, ISH data were analyzed by counting the number of cells with positive nuclear signals. Each synapsin riboprobe significantly labeled only cells expressing the cognate synapsin isoform, validating the specificity of each riboprobe. Asterisks indicate p < 0.05 by t test or ANOVA with Holm–Bonferroni post hoc test.
Figure 2.
Figure 2.
Expression of synapsin isoforms in cultured hippocampal neurons. A, TKO neurons expressing GFP-synapsin Ia (green) were stained with anti-VGAT antibody (red) to define GABAergic presynaptic terminals. Region indicate by white rectangle is enlarged below, with merged image (right) illustrating colocalization (yellow) of synapsin Ia and VGAT. B, Quantification of GFP fluorescence in inhibitory synaptic boutons (defined by VGAT staining) from neurons expressing GFP-tagged versions of each synapsin isoform. Number of cells: synapsin Ia (8), synapsin Ib (8), synapsin IIa (5), synapsin IIb (7), and synapsin IIIa (6). CE, Western blot analysis of endogenous synapsin expression in TWT neurons and exogenous synapsin expression in TKO neurons infected with virus expressing indicated synapsin isoforms. Antibodies against synapsin IIa (C), synapsin Ib (D), and synapsin I (E) were used in Western blots (top) to quantify antibody labeling (bottom). Labeling was normalized by levels of GAPDH as a loading control. Values indicate means ± SEM, with n = 5 for each measurement. Asterisks indicate statistical significance (p < 0.05) by t test or ANOVA with Holm–Bonferroni post hoc test.
Figure 3.
Figure 3.
Expression of synapsin isoforms in hippocampal interneurons. A, Representative ISH images from mouse hippocampal sections using the indicated riboprobes. Top rows of images were taken at low magnification, whereas bottom rows show high-magnification images taken from the areas indicated by rectangles in the low-magnification images. B, Quantification of labeling of interneurons by the indicated riboprobes. Interneurons were identified by their location outside of pyramidal cell or granule cell layers. The GAD67 and synapsin IIa and synapsin IIIa groups are significantly different from each other and from the other groups (asterisks indicate p < 0.05 by ANOVA with Holm–Bonferroni post hoc test). Values indicate mean number (±SEM) of labeled cells per section. Number of sections are as follows: GAD67 (10), synapsin Ia (16), synapsin Ib (16), synapsin IIa (21), synapsin IIb (14), and synapsin IIIa (17), taken from six different mouse brains.
Figure 4.
Figure 4.
Distribution of synapsin expression in hippocampal interneurons. A, Labeling of interneurons in indicated regions with indicated riboprobes. Values indicate mean number (±SEM) of labeled cells per section. Note change in y-axis scale between GAD67 and synapsin probes. B, C, Synapsin isoform expression was normalized by GAD67 expression and compared across the indicated hippocampal regions. DG, Dentate gyrus; SLM, stratum lacunosum-moleculare; SO, stratum oriens; SR, stratum radiatum; SL, stratum lucidum.
Figure 5.
Figure 5.
Synapsins rescue amplitude of eIPSCs in TKO neurons. A, Representative eIPSCs (single trials) recorded from TWT and TKO neurons, as well as from TKO neurons expressing indicated synapsin isoforms. Stimulus artifact has been blanked for clarity. B, Mean amplitudes of evoked IPSCs in TWT (black, n = 14) and TKO neurons (white, n = 14), as well as in TKO neurons expressing indicated synapsin isoforms (shaded). TKO and TWT data were compared with unpaired t test, whereas the rest were compared by ANOVA with Holm–Bonferroni post hoc test; asterisks indicate significant differences (p < 0.05). Sample sizes for each isoform are as follows: synapsin Ia (15), Ib (25), IIa (14), IIb (17), and IIIa (19).
Figure 6.
Figure 6.
eIPSC kinetics are regulated by synapsins. A, Evoked IPSCs recorded from TWT and TKO neurons. Superimposed, scaled traces at right illustrate different decay kinetics for eIPSCs from TWT and TKO neurons. Traces represent averaged eIPSCs from 14 TWT neurons and 14 TKO neurons. B, C, Mean rise times (20–80%) and decay time constants measured for eIPSCs in TWT and TKO neurons, as well as in TKO neurons expressing indicated synapsin isoforms. eIPSC decay was prolonged in TKO neurons, as well as in TKO neurons expressing synapsin IIIa. D, Mean eIPSC charge for TWT and TKO neurons, as well as TKO neurons expressing indicated synapsin isoforms. E, Mean quantal content of eIPSCs in TWT and TKO neurons, as well as TKO neurons expressing indicated synapsin isoforms. F, Averaged and normalized eIPSC traces from neurons of the indicated genotypes. G, Integrated eIPSCs calculated from traces in F. For BE, statistical comparisons were done with ANOVA, followed by Holm–Bonferroni post hoc test; asterisks indicate significant differences (p < 0.05). Number of cells used to generate data in BG: TWT (14), TKO (14), synapsin Ia (15), synapsin Ib (25), synapsin IIa (14), synapsin IIb (17), and synapsin IIIa (19).
Figure 7.
Figure 7.
Properties of mIPSCs. A, Left, representative traces of mIPSCs recorded in TWT and TKO neurons, as well in TKO neurons expressing indicated synapsin isoforms. Right, Averaged mIPSCs. In each case, mIPSCs were sampled for 60 s. B, Mean mIPSC frequency of TWT (black, n = 15) and TKO (white, n = 12) neurons, as well as TKO neurons expressing indicated synapsin isoforms (shaded). Sample sizes for each isoform are: synapsin Ia (20), synapsin Ib (11), synapsin IIa (11), synapsin IIb (25), and synapsin IIIa (15). CE, Effects of synapsin isoforms on amplitude (C), rise time (D), and decay time (E) of mIPSCs. For BE, statistical comparisons were done with ANOVA, followed by Holm–Bonferroni post hoc test; there were no significant differences (p > 0.05).
Figure 8.
Figure 8.
Synapsins influence the rate of quantal GABA release. A, Deconvolution analysis was used to determine rate of quantal release from average eIPSC waveforms. Left, Release rates for TWT and TKO neurons. Right, Same as left but scaled to the same maxima and superimposed. B, Integrals of release rate plots shown at left of A. C, Mean release rate constants for integrated release were determined for indicated genotypes. Release rate constants were prolonged in TKO neurons, as well as in TKO neurons expressing synapsin IIIa. D, Integrated amount of release for indicated isoforms. For C and D, asterisks indicate significant differences (p < 0.05) between TWT and TKO, determined by unpaired t test, and between TKO neurons expressing indicated synapsin isoforms, determined by ANOVA with Holm–Bonferroni post hoc test. E, Deconvolution analysis of release rates of TWT and TKO neurons, as well as TKO neurons expressing individual synapsin isoforms. Sample sizes for each group are as follows: TWT (14), TKO (14), synapsin Ia (15), synapsin Ib (25), synapsin IIa (14), synapsin IIb (17), and synapsin IIIa (19). F, Integrals of release calculated from traces in E.
Figure 9.
Figure 9.
Recovery from synaptic depression measured with pairs of stimuli delivered at various interstimulus intervals. A, Examples of depression of eIPSCs in a TWT neuron. B, Kinetics of recovery from depression for TWT (black, n = 16) and TKO (red, n = 17) neurons (note logarithmic coordinates). Depression was less for TKO neurons at 100 and 150 ms interstimulus intervals. Statistical comparisons were done with unpaired t test; asterisks indicate significant differences (p < 0.05). C, Comparison of recovery from depression for TKO neurons, as well as TKO neurons expressing indicated synapsin isoforms (note logarithmic coordinates). Sample sizes are as follows: synapsin Ia (17), synapsin Ib (21), synapsin IIa (15), synapsin IIb (23), and synapsin IIIa (15). D, Mean time constants of recovery from depression for each genotype, determined as in C. Depression recovered significantly faster in TKO neurons For C and D, statistical comparisons were done with ANOVA, followed by Holm–Bonferroni post hoc test; asterisks indicate significant differences (p < 0.05).
Figure 10.
Figure 10.
Synapsin IIIa accelerates synaptic depression. Time courses of synaptic depression at inhibitory synapses activated by trains of 500 stimuli applied at 10 Hz are shown. A, Depression of eIPSC amplitudes during the stimulus trains; amplitude of every tenth eIPSC is plotted. B, Mean time constant of depression in TWT and TKO neurons, as well as in TKO neurons expressing indicated synapsin isoforms. Depression was significantly faster in TKO neurons expressing synapsin IIIa. Statistical comparisons were done with ANOVA, followed by Holm–Bonferroni post hoc test; asterisks indicate significant differences (p < 0.05). C, Correlation (r2 = 0.91) between rate of depression and the amount of transmitter release, as measured by eIPSC charge. Points indicate mean values ± SEM for indicated genotypes, as well as TWT neurons exposed to high (4 mm) external Ca2+. Sample sizes are as follows: TWT (12), TKO (10), synapsin Ia (13), synapsin Ib (11), synapsin IIa (17), synapsin IIb (10), synapsin IIIa (17), and TWT in 4 mm [Ca2+] (14).
Figure 11.
Figure 11.
Synapsins do not affect RRP size or mobilization of SVs from the RP. A, Time course of cumulative IPSC charge during trains of 500 stimuli applied at 10 Hz. Amplitude of every tenth eIPSC is plotted. Data points from 20 to 50 s were fitted by linear regression and line was extrapolated back to the y-intercept to estimate RRP size. B, Mean RRP values determined for TWT and TKO neurons, as well as TKO neurons expressing indicated synapsin isoforms. C, Mean values of SV mobilization from RP to RRP, presented as in B. D, Release probability calculated from RRP size. Values indicate means ± SEM. Sample sizes for each group are as follows: TWT (12), TKO (10), synapsin Ia (13), synapsin Ib (11), synapsin IIa (17), synapsin IIb (10), synapsin IIIa (17), and TWT in 4 mm [Ca2+] (14). For BD, statistical comparisons were done with ANOVA, followed by Holm–Bonferroni post hoc test; asterisks indicate significant differences (p < 0.05).
Figure 12.
Figure 12.
Model for regulation of GABA release from RRP by synapsins. Although most synapsins allow GABA release to be synchronized by a presynaptic action potential, synapsin IIIa does not but increases the probability of GABA release from the RRP.

Similar articles

Cited by

References

    1. Akbergenova Y, Bykhovskaia M. Synapsin maintains the reserve vesicle pool and spatial segregation of the recycling pool in Drosophila presynaptic boutons. Brain Res. 2007;1178:52–64. doi: 10.1016/j.brainres.2007.08.042. - DOI - PubMed
    1. Baldelli P, Fassio A, Valtorta F, Benfenati F. Lack of synapsin I reduces the readily releasable pool of synaptic vesicles at central inhibitory synapses. J Neurosci. 2007;27:13520–13531. doi: 10.1523/JNEUROSCI.3151-07.2007. - DOI - PMC - PubMed
    1. Banker G, Goslin K. Culturing nerve cells. Cambridge, MA: MIT; 1984.
    1. Bi GQ, Poo MM. Synaptic modifications in cultured hippocampal neurons: dependence on spike timing, synaptic strength, and postsynaptic cell type. J Neurosci. 1998;18:10464–10472. - PMC - PubMed
    1. Brautigam CA, Chelliah Y, Deisenhofer J. Tetramerization and ATP binding by a protein comprising the A–C domains of rat synapsin I. J Biol Chem. 2004;279:11948–11956. doi: 10.1074/jbc.M312015200. - DOI - PubMed

Publication types

MeSH terms

LinkOut - more resources