. 2016 Jun 22;36(25):6758-70.
doi: 10.1523/JNEUROSCI.0493-16.2016.

Using Diffusion Tractography to Predict Cortical Connection Strength and Distance: A Quantitative Comparison with Tracers in the Monkey

Affiliations

Using Diffusion Tractography to Predict Cortical Connection Strength and Distance: A Quantitative Comparison with Tracers in the Monkey

Chad J Donahue et al. J Neurosci. .

Abstract

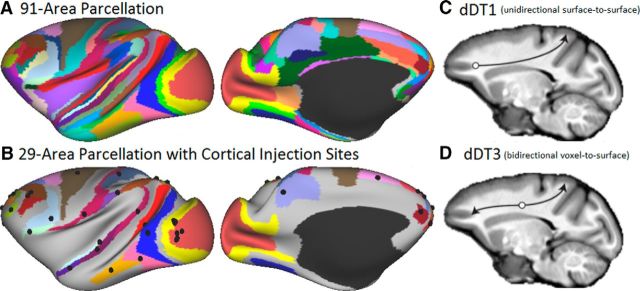
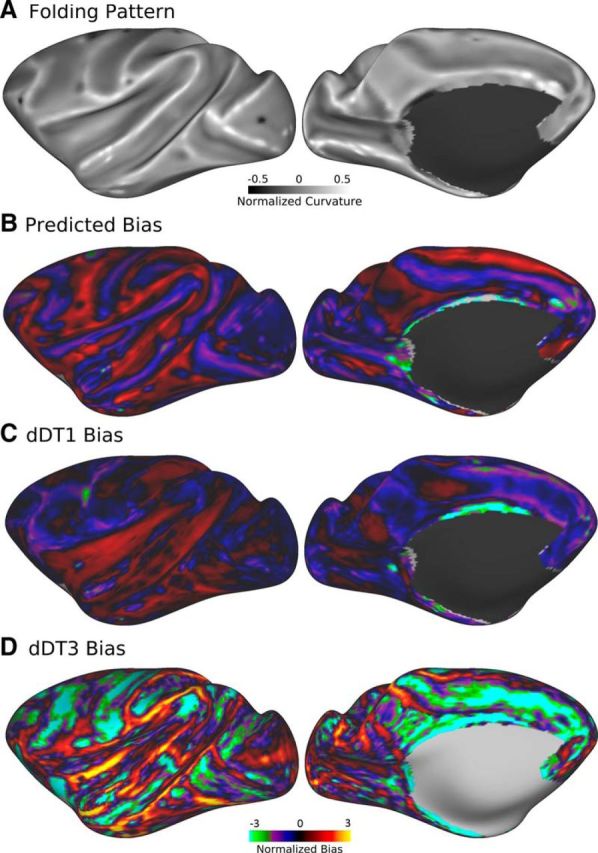
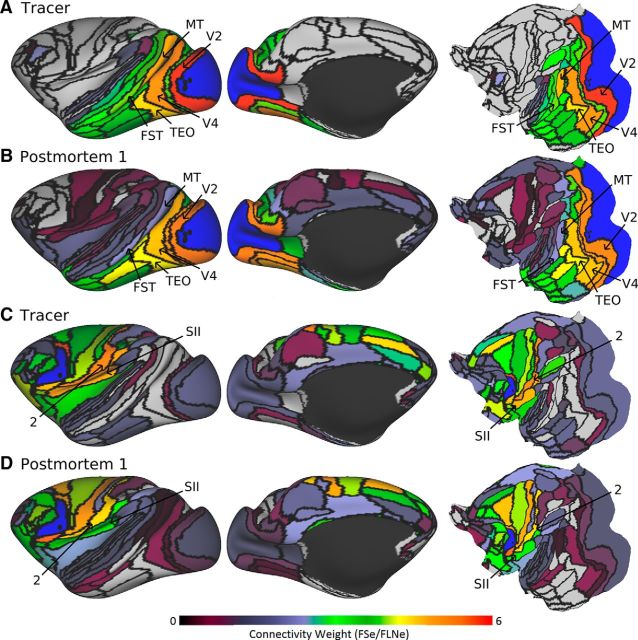
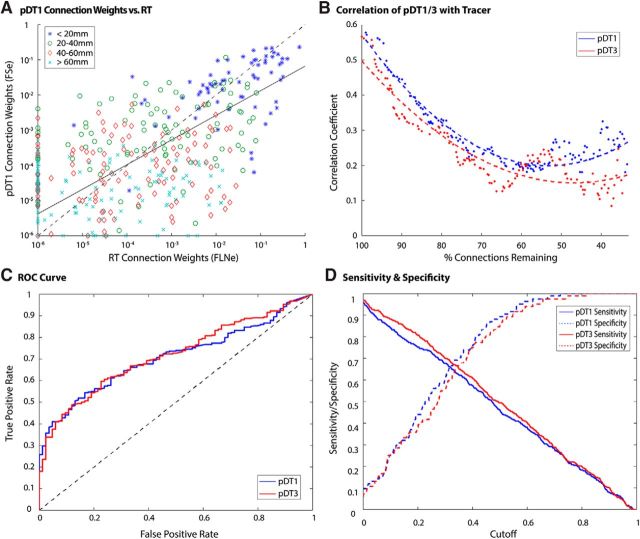
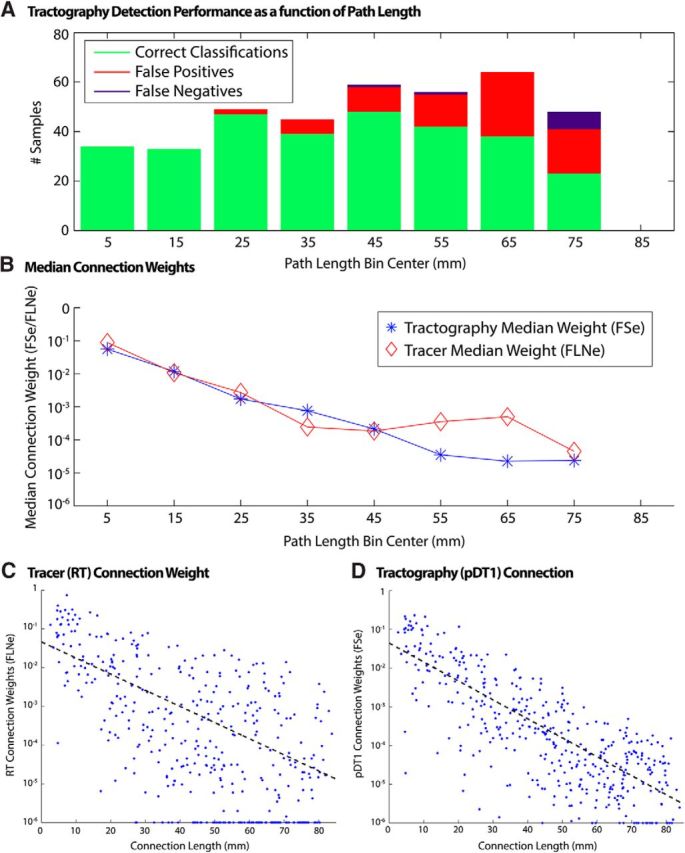
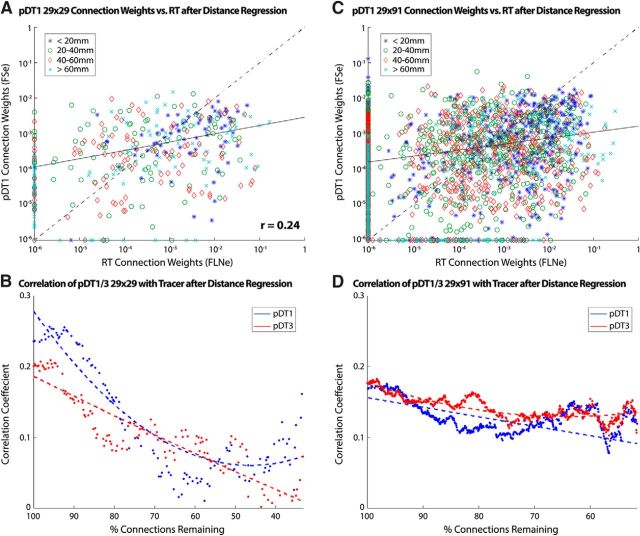
Tractography based on diffusion MRI offers the promise of characterizing many aspects of long-distance connectivity in the brain, but requires quantitative validation to assess its strengths and limitations. Here, we evaluate tractography's ability to estimate the presence and strength of connections between areas of macaque neocortex by comparing its results with published data from retrograde tracer injections. Probabilistic tractography was performed on high-quality postmortem diffusion imaging scans from two Old World monkey brains. Tractography connection weights were estimated using a fractional scaling method based on normalized streamline density. We found a correlation between log-transformed tractography and tracer connection weights of r = 0.59, twice that reported in a recent study on the macaque. Using a novel method to estimate interareal connection lengths from tractography streamlines, we regressed out the distance dependence of connection strength and found that the correlation between tractography and tracers remains positive, albeit substantially reduced. Altogether, these observations provide a valuable, data-driven perspective on both the strengths and limitations of tractography for analyzing interareal corticocortical connectivity in nonhuman primates and a framework for assessing future tractography methodological refinements objectively.

Significance statement: Tractography based on diffusion MRI has great potential for a variety of applications, including estimation of comprehensive maps of neural connections in the brain ("connectomes"). Here, we describe methods to assess quantitatively tractography's performance in detecting interareal cortical connections and estimating connection strength by comparing it against published results using neuroanatomical tracers. We found the correlation of tractography's estimated connection strengths versus tracer to be twice that of a previous study. Using a novel method for calculating interareal cortical distances, we show that tractography-based estimates of connection strength have useful predictive power beyond just interareal separation. By freely sharing these methods and datasets, we provide a valuable resource for future studies in cortical connectomics.

Keywords: cerebral cortex; connectivity; diffusion tractography; macaque; neuroanatomy; retrograde tracing.


Figures

Figure 1.
Figure 1.
Markov et al. (2014) macaque cortical parcellation mapped to the inflated left hemisphere of the Macaque Yerkes19 atlas and diffusion tractography seeding strategies. A, The 91-area parcellation used for both retrograde tracer and tractography analyses. B, The 29 areas associated with cortical injection sites areas, with injection locations (black spheres) reported by Markov et al. (2014) projected to the cortical surface. C, dDT1, surface-to-surface tractography seeding strategy. D, dDT3, dual voxel-to-surface tractography seeding strategy. Full data are available at https://balsa.wustl.edu/RP92.
Figure 2.
Figure 2.
Geometry-predicted versus observed tractography streamline density biases for monkey PM1 normalized to the mean streamline density at flat regions (sulcal banks). A, Folding pattern. B, Geometric bias predicted via the ratio of cortical GM volume to WM surface area. C, D, Observed tractography bias of dDT1/3 computed via average streamline density at each surface vertex. Scale bars are in log2 units. Full data are available at https://balsa.wustl.edu/R7kj.
Figure 3.
Figure 3.
Tracer and tractography log-scale connection weights for area V1 (A, B) and F5 (C, D). Retrograde tracer connection weights were based on FLNe to each injected area from the full 91-area parcellation. Tractography brain postmortem 1 was FSe. Areas V1 and F5 are labeled in blue in A, B and C, D, respectively. Black spheres illustrate the corresponding tracer injection sites for each area. Full data are available at https://balsa.wustl.edu/R698 and https://balsa.wustl.edu/R1Xr.
Figure 4.
Figure 4.
Tracer versus tractography performance comparison. A, Scatterplot of RT vs tractography (pDT1) log-scale connection weights in case PM1. Data points are depicted according to their corresponding path length bin (bin width = 20 mm; excluded path lengths > 80 mm, n = 10). The solid line denotes the least absolute residuals fit to data excluding points along either axis (false negatives: n = 13; false positives: n = 76). The dashed line (y = x) is for reference. B, Correlation between tractography and tracer connectivity weight in case PM1 for pDT1 and pDT3. Dotted lines represent second-order polynomial fits to the plotted data points. The horizontal axis depicts the number of connections remaining in tractography matrices. Only true positives were considered in this analysis. The final 10% of values were excluded due to low sample size. C, x-axis represents false positive rate (FPR); y-axis represents true positive rate (TPR). Results suggest similar performance for pDT1 and pDT3. D, Sensitivity and specificity were similar for pDT1/3. Cutoff refers to the experimental connection weight detection threshold.
Figure 5.
Figure 5.
Tractography performance as a function of path length. A, Number of correct tractography detections, false positives, and false negatives (using tracer as ground truth). B, Median connection weights of correctly classified connections binned by tractography-measured connection path length. C, Tracer connection weights versus tractography-derived path length. D, Tractography connection weights versus tractography-derived path length. Solid lines correspond to least absolute residual fit to data excluding points along axes.
Figure 6.
Figure 6.
Comparison of tracer versus tractography log-scale connection weights with reduced path length dependency. A, Tracer and tractography log-scale connection weights after regression of estimated exponential relationship. Data points are depicted according to their corresponding path length bin (bin width = 20 mm; excluded path lengths >80 mm, 2.5% of all connections). The solid line denotes the LAR fit to data excluding points along either. The dashed line (y = x) is for reference. B, Correlation between tractography and tracer connectivity weight in case PM1 for pDT1 and pDT3 after regression of estimated exponential relationship. Dotted lines represent second-order polynomial fits to the plotted data points. Data inclusion is as described in Figure 3. C, D, Analyses from A and B applied to full 29 × 91 connectivity dataset. The increase in false negatives (n = 128) and false positives (n = 788) were proportional to sample size. The correlation between tracer and tractography connection weight was r = 0.43.

References

    1. Ambrosen KS, Herlau T, Dyrby T, Schmidt MN, Morup M. Comparing structural brain connectivity by the infinite relational model. Proceedings - 3rd International Workshop on Pattern Recognition in Neuroimaging, PRNI 2013; 2013. 50–53.
    1. Azadbakht H, Parkes LM, Haroon HA, Augath M, Logothetis NK, de Crespigny A, D'Arceuil HE, Parker GJ. Validation of high-resolution tractography against in vivo tracing in the macaque visual cortex. Cereb Cortex. 2015;25:4299–4309. doi: 10.1093/cercor/bhu326. - DOI - PMC - PubMed
    1. Basser PJ, Pajevic S, Pierpaoli C, Duda J, Aldroubi A. In vivo fiber tractography using DT-MRI data. Magn Reson Med. 2000;44:625–632. doi: 10.1002/1522-2594(200010)44:4%3C625::AID-MRM17%3E3.0.CO%3B2-O. - DOI - PubMed
    1. Beckmann M, Johansen-Berg H, Rushworth MF. Connectivity-based parcellation of human cingulate cortex and its relation to functional specialization. J Neurosci. 2009;29:1175–1190. doi: 10.1523/JNEUROSCI.3328-08.2009. - DOI - PMC - PubMed
    1. Behrens TE, Johansen-Berg H, Woolrich MW, Smith SM, Wheeler-Kingshott CA, Boulby PA, Barker GJ, Sillery EL, Sheehan K, Ciccarelli O, Thompson AJ, Brady JM, Matthews PM. Non-invasive mapping of connections between human thalamus and cortex using diffusion imaging. Nat Neurosci. 2003;6:750–757. doi: 10.1038/nn1075. - DOI - PubMed

Publication types