. 2016 Jun 22;36(25):6820-35.
doi: 10.1523/JNEUROSCI.3667-15.2016.

Cell-Type-Specific Modulation of Sensory Responses in Olfactory Bulb Circuits by Serotonergic Projections from the Raphe Nuclei

Affiliations

Cell-Type-Specific Modulation of Sensory Responses in Olfactory Bulb Circuits by Serotonergic Projections from the Raphe Nuclei

Daniela Brunert et al. J Neurosci. .

Abstract

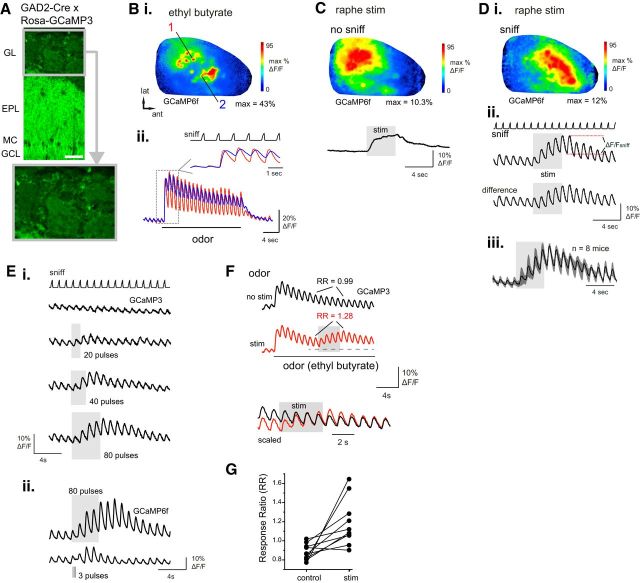
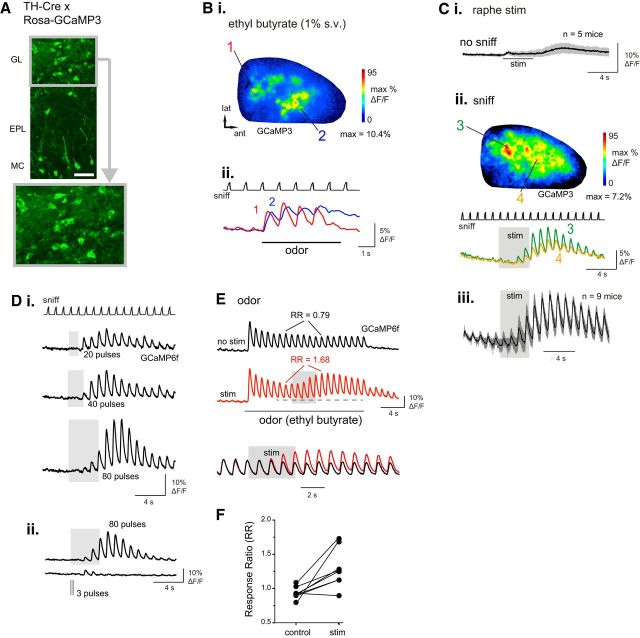
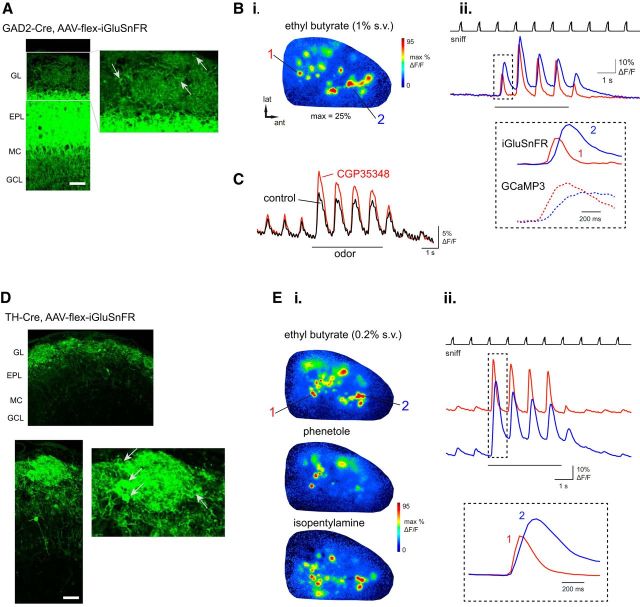
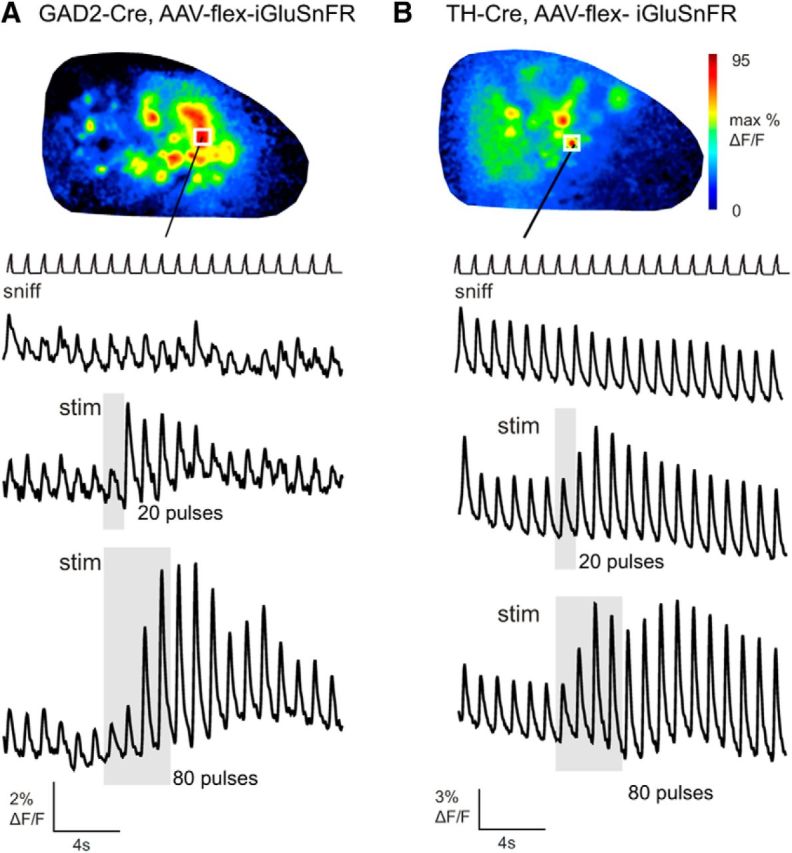
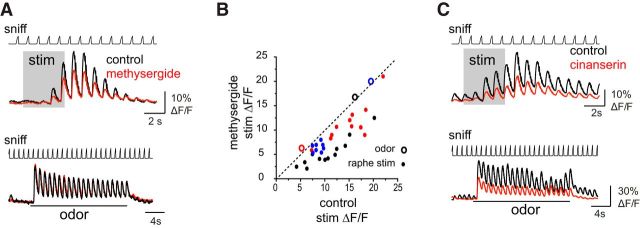
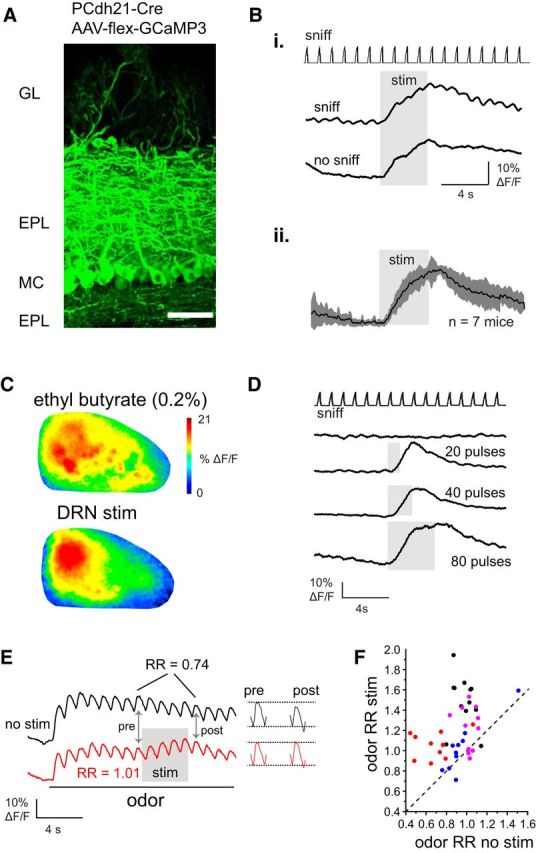
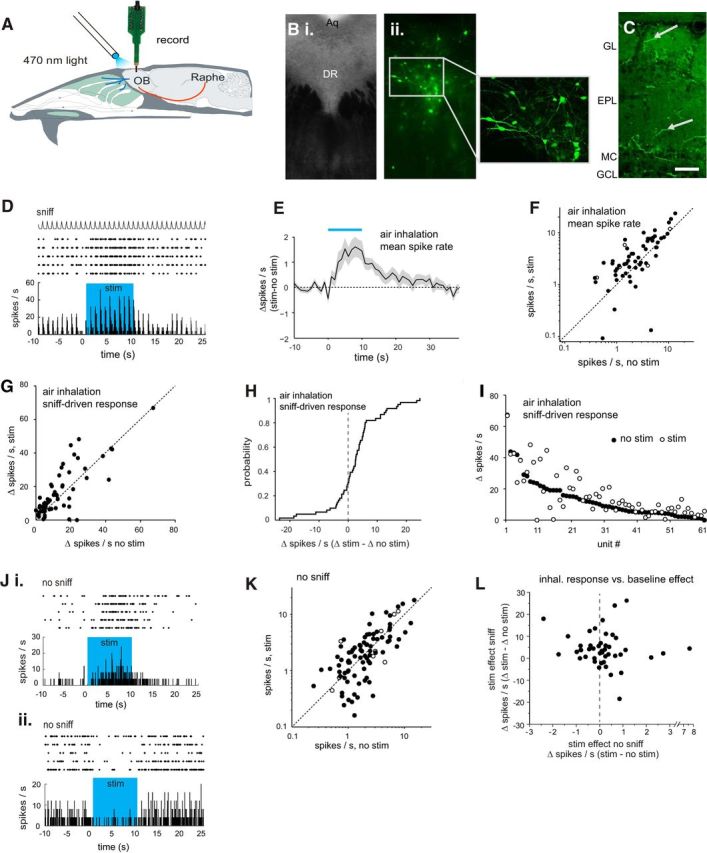
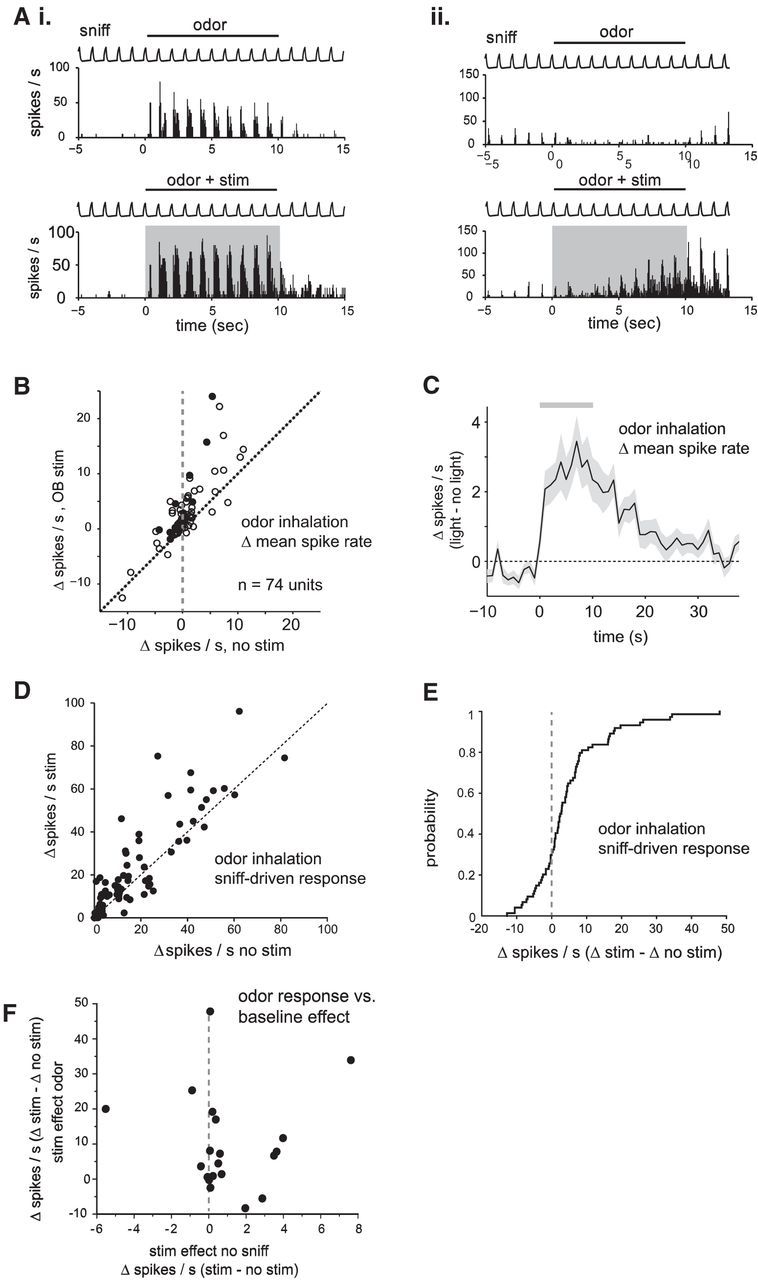
Serotonergic neurons in the brainstem raphe nuclei densely innervate the olfactory bulb (OB), where they can modulate the initial representation and processing of olfactory information. Serotonergic modulation of sensory responses among defined OB cell types is poorly characterized in vivo Here, we used cell-type-specific expression of optical reporters to visualize how raphe stimulation alters sensory responses in two classes of GABAergic neurons of the mouse OB glomerular layer, periglomerular (PG) and short axon (SA) cells, as well as mitral/tufted (MT) cells carrying OB output to piriform cortex. In PG and SA cells, brief (1-4 s) raphe stimulation elicited a large increase in the magnitude of responses linked to inhalation of ambient air, as well as modest increases in the magnitude of odorant-evoked responses. Near-identical effects were observed when the optical reporter of glutamatergic transmission iGluSnFR was expressed in PG and SA cells, suggesting enhanced excitatory input to these neurons. In contrast, in MT cells imaged from the dorsal OB, raphe stimulation elicited a strong increase in resting GCaMP fluorescence with only a slight enhancement of inhalation-linked responses to odorant. Finally, optogenetically stimulating raphe serotonergic afferents in the OB had heterogeneous effects on presumptive MT cells recorded extracellularly, with an overall modest increase in resting and odorant-evoked responses during serotonergic afferent stimulation. These results suggest that serotonergic afferents from raphe dynamically modulate olfactory processing through distinct effects on multiple OB targets, and may alter the degree to which OB output is shaped by inhibition during behavior.

Significance statement: Modulation of the circuits that process sensory information can profoundly impact how information about the external world is represented and perceived. This study investigates how the serotonergic system modulates the initial processing of olfactory information by the olfactory bulb, an obligatory relay between sensory neurons and cortex. We find that serotonergic projections from the raphe nuclei to the olfactory bulb dramatically enhance the responses of two classes of inhibitory interneurons to sensory input, that this effect is mediated by increased glutamatergic drive onto these neurons, and that serotonergic afferent activation alters the responses of olfactory bulb output neurons in vivo These results elucidate pathways by which neuromodulatory systems can dynamically regulate brain circuits during behavior.

Keywords: imaging; inhibition; neuromodulation; optogenetics; serotonin; sniffing.


Figures

Figure 1.
Figure 1.
Electrical stimulation of raphe enhances sensory responses in GAD65-positive OB neurons. A, Overview of GCaMP3 expression in the OB of a GAD2-Cre:Rosa-GCaMP3 cross. Bottom, Magnified view of glomerular layer, with individual PG somata visible around the periphery of the glomerulus. Scale bar, 50 μm. GL, Glomerular layer; EPL, external plexiform layer; MC, mitral cell layer; GCL, granule cell layer. B, Odorant-evoked GCaMP signals imaged from the dorsal OB of a GAD2-Cre:Rosa-GCaMP6f mouse. Bi, Response map showing change in fluorescence evoked by ethyl butyrate (0.1%, s.v.). Bii, Traces showing time course of GCaMP signal in two ROIs in the caudal-lateral (1) and rostral-medial (2) OB, with distinct inhalation-linked time courses in each ROI. Inset, Expansion of boxed region illustrating temporal differences. “Sniff” trace in inset shows timing of artificial inhalation. C, GAD2+ GCaMP6f signal evoked by raphe stimulation (20 Hz, 80 pulses) in the absence of inhalation-driven sensory input. Same preparation as in B. Top, Response map showing fluorescence change after raphe stimulus train. Note widespread increase with multiple foci of high-magnitude increases. Trace shows time course of GCaMP6f signal averaged across 10 ROIs from the same preparation. D, GAD2+ GCaMP6f signal during artificial inhalation of ambient air and raphe stimulation. Same preparation as in B. Di, Response map showing inhalation-linked fluorescence change during raphe stimulation, defined as ΔF/Fsniff in Dii. Inhalation-evoked responses are widespread across the dorsal OB but include distinct foci of peak enhancement. Dii, Time course of GCaMP6f signal (same ROIs as in C) during inhalation of ambient air (sniff), before and after (difference) subtracting the trace of raphe stimulation without inhalation, showing persistent increases in inhalation response amplitudes. Diii, Time course of mean GCaMP signal elicited by raphe stimulation, normalized and averaged across eight mice. Shaded area indicates SD across mice. Across all mice, stimulation strongly enhances inhalation responses, which persist for at least 8 s after stimulation ceases. E, Increasing raphe stimulus train duration increases both the magnitude and duration of the enhanced response to air inhalation. Ei, GCaMP3 traces taken from a single ROI during stimulus trains from 20 pulses to 80 pulses (all at 20 Hz). Current intensity, 400 μA. Eii, GCaMP6f traces from a different preparation comparing responses during the standard 80 pulse train (top) with responses to a train of 3 pulses of 1 ms duration, delivered at 10 Hz. Current intensity, 250 μA. F, Raphe stimulation increases inhalation-linked response magnitudes during odorant inhalation. Traces show mean signal averaged across 10 odorant-responsive ROIs from the same preparation, without (black) and with (red) raphe stimulation delivered during a prolonged odorant presentation (ethyl butyrate, 0.2%, s.v.). RR is defined as the ratio of the inhalation responses before and after stimulation within the same trial. See Results for details. Bottom traces show an excerpt from each trial (indicated by horizontal dashed line) with the vertical scales normalized to the same inhalation response amplitude for the inhalation just before the raphe stimulus train. G, Effect of raphe stimulation on odorant-evoked RRs, measured from signals averaged across 8–10 responsive ROIs in each of 10 preparations, with and without raphe stimulation. Each pair of points represents one mouse.
Figure 2.
Figure 2.
Electrical stimulation of raphe enhances sensory responses in TH-positive juxtaglomerular neurons. A, Overview of GCaMP3 expression in the OB of a TH-Cre:Rosa-GCaMP3 cross. Lower image shows magnified view of glomerular layer, with individual SA somata visible. Scale bar, 50 μm. B, Odorant-evoked responses imaged from a TH-Cre:Rosa-GCaMP3 mouse. Bi, Response map showing change in fluorescence evoked by ethyl butyrate (1%, s.v.). Bii, Time course of GCaMP3 signal in two ROIs located in the caudal-lateral (1) and anteromedial (2) OB, with distinct inhalation-linked time courses similar to those seen for GAD2+ signals. C, Raphe modulation of TH+ GCaMP signal during artificial inhalation of ambient air and raphe stimulation (20 Hz, 80 pulses). Ci, Mean and SD of GCaMP signal evoked by raphe stimulation in the absence of inhalation (“no sniff”), averaged from air-responsive ROIs in five mice, showing no significant change in fluorescence during raphe stimulation and a slight increase after the end of the train attributable to hemodynamic effects. Cii, Response map showing GCaMP3 fluorescence change after raphe stimulation (same preparation as in B, with widespread increases and peak increases in distinct foci. Cii, Traces taken from two ROIs showing time course of stimulation effect. Ciii, Time course of mean and SD of GCaMP signal elicited by raphe stimulation, averaged across nine mice. As with the GAD2+ signal, raphe stimulation effects on the TH+ GCaMP signal persist for at least 8 s after stimulation ceases. D, Effect of raphe stimulus train duration on TH+ responses to air inhalation. Traces show GCaMP6f signal averaged from 10 ROIs in one mouse. Di, Responses to stimulus trains (20 Hz) of increasing duration elicit larger and longer-lasting enhancement of inhalation responses. Current intensity, 400 μA. Dii, Different preparation showing comparison of effects of an 80 pulse, 20 Hz train (0.1 ms pulse duration) and a 3 pulse, 10 Hz train (1 ms pulse duration) measured from the same ROIs. Current intensity, 250 μA. E, Traces showing raphe-stimulated increase in inhalation-linked responses in TH+ neurons during odorant inhalation. Traces show mean GCaMP6f signal averaged across 10 odorant-responsive ROIs from the same preparation, delivered during presentation of odorant (ethyl butyrate, 0.1%, s.v.), as in Figure 1. Bottom traces show an excerpt from each trial (indicated by horizontal dashed line) with the vertical scales normalized to the same inhalation response amplitude for the inhalation just before the raphe stimulus train. F, Effect of raphe stimulation on odorant-evoked RRs, measured and plotted for each of eight TH+ preparations as in Figure 1.
Figure 3.
Figure 3.
Imaging glutamatergic input to juxtaglomerular interneurons with iGluSnFR. A, Expression of iGluSnFR in GAD2+ OB neurons after injection of AAV-flex-iGluSnFR into the OB of a GAD2-Cre mouse, with similar expression patterns to GAD2-Cre:Rosa-GCaMP3 crosses. Right panel shows magnified view of glomerular layer. Arrows indicate presumed PG cell somata. Scale bar, 50 μm. B, iGluSnFR response map (Bi) and traces (Bii) showing time course of iGluSnFR signal taken from a caudal-lateral (1) and anteromedial (2) ROI. Inset, Expansion of iGluSnFR response to first inhalation of odorant for each ROI, with GCaMP3 signals imaged from ROIs taken from similar dorsal locations (same data as from Fig. 1B) shown for comparison. Note faster onset and decay kinetics for iGluSnFR compared with GCaMP3 signals, but with a similar temporal shift between anteromedial and caudal-lateral ROIs. C, Odorant-evoked iGluSnFR signal (average of 10 ROIs) in control conditions and after topical application of the GABAB receptor antagonist CGP35348 (1 mm), showing an increase in inhalation-linked glutamate release onto GAD2+ neurons. D, Expression of iGluSnFR in TH+ OB neurons after injection of AAV-flex-iGluSnFR into the OB of a TH-Cre mouse, with similar expression patterns to TH-Cre:Rosa-GCaMP3 crosses. Bottom, Magnified view of glomerular layer. Arrows indicate presumed SA cell somata. Scale bar, 50 μm. E, iGluSnFR response maps (E) and traces (Eii) taken from a caudal-lateral (1) and anteromedial (2) ROI. Maps show clear glomerular foci with distinct spatial response patterns for each odorant. Inset, Expansion of iGluSnFR response to first inhalation of odorant for each ROI. This example also includes clear responses to inhalation preceding odorant presentation.
Figure 4.
Figure 4.
Electrical stimulation of raphe enhances inhalation-driven glutamatergic input to juxtaglomerular interneurons. A, Raphe stimulation elicits an increase in the magnitude of inhalation-linked iGluSnFR transients imaged from GAD2+ neurons during inhalation of ambient air. Traces show time course of iGluSnFR signal with no stimulation (top trace), a 20 pulse stimulus train (middle trace) and an 80 pulse train (bottom trace). Response map at top shows map of fluorescence increase at the end of the 80 pulse train. White square indicates ROI from which traces are taken. B, Raphe stimulation causes a similar increase in iGluSnFR signals imaged from TH+ neurons, with increasing effect size and duration with a longer (80 pulse) stimulus train.
Figure 5.
Figure 5.
5-HT receptor antagonists partially block raphe stimulation effects on sensory responses. A, Top, GCaMP6f signals imaged from TH+ neurons showing raphe stimulation enhancement of responses to air inhalation in control conditions and after application of the 5-HTR antagonist methysergide (200 μm). Bottom, Signals from the same ROIs showing that odorant-evoked signals are unaffected by methysergide. B, Scatter plot of inhalation-linked responses measured from individual ROIs from three preparations (2 TH+; black, red points, 1 GAD2+; blue points), showing response to air inhalation (measured from the first inhalation after the end of the stimulus train) in control versus after methysergide conditions. All ROIs show suppressed response amplitudes. Large circles show mean odorant-evoked response amplitudes, averaged across the same ROIs in each preparation, showing no effect on odorant responses. C, Example of GCaMP6f signals imaged from GAD2+ neurons showing effects of the 5-HT2R-selective antagonist cinanserin (200 μm) on responses to air and odorant inhalation. Cinanserin reduces the effect of raphe stimulation (top traces), but also suppresses responses to air and odorant inhalation in the absence of stimulation (bottom traces, same ROIs).
Figure 6.
Figure 6.
Raphe stimulation increases basal calcium signaling in mitral/tufted cells without affecting evoked sensory responses. A, Expression of GCaMP3 in OB MT cells after injection of AAV-flex-GCaMP3 into the anterior piriform cortex of a Pcdh21-Cre mouse. Scale bar, 50 μm. Bi, Example of PCdh21+ fluorescence changes evoked by raphe stimulation during inhalation of ambient air (sniff) and in the same ROIs in the absence of inhalation (no sniff). Note that the tonic fluorescence increase is nearly identical in the presence and absence of inhalation. Bii, Mean MT cell GCaMP signal elicited by raphe stimulation during inhalation of ambient air (sniff trace not shown), averaged across seven mice, showing gradual fluorescence increase and recovery with no apparent enhancement of inhalation-linked responses, in contrast to the effects seen in GAD2+ and TH+ neurons. C, MT cell response maps elicited by odorant (top) and raphe stimulation during ambient air inhalation (bottom), with raphe stimulation eliciting a diffuse increase that was largest in the caudal OB. D, Example of PCdh21+ MT cell GCaMP signals elicited by raphe stimulus trains of increasing duration, with longer duration trains leading to slower recovery to baseline after the stimulation ceases but no emergence of inhalation-linked transients. E, MT cell responses to raphe stimulation during odorant. Traces show GCaMP signals averaged across 10 odorant-responsive ROIs (ethyl butyrate, 0.2%, s.v.) with and without raphe stimulation. Same mouse as shown in C. Raphe stimulation elicits only a small fluorescence increase in the presence of odorant, with a very small increase in the amplitude of the inhalation-linked transient. Snippets of the response just before (“pre”) and just after (“post”) the stimulus train are shown to the right. F, Scatter plot of odorant RR measured separately for 10–12 ROIs in each of four preparations (0.2–0.5%, s.v. ethyl butyrate, preparation indicated by color), showing a range of effects of raphe stimulation on odorant RR with most ROIs showing an increase.
Figure 7.
Figure 7.
Optogenetic activation of serotonergic OB afferents from raphe alters MT cell excitation. A, Schematic of experimental approach for electrical recording of presumptive MT cells during optical stimulation of serotonergic projections to the OB. See Materials and Methods for details. B, Images from midbrain tissue sections showing expression of CHR2-eYFP after injection of AAV-Flex-ChR2-eYFP into DRN of a Slc6a4-Cre mouse. Bi, Phase contrast bright-field image of region targeted for virus injection. Bii, Confocal image of the same section with higher-magnification of DRN region (inset, left) showing CHR2-eYFP expression in neurons throughout DRN. Aq, Cerebral aqueduct; DR, dorsal raphe. C, Confocal image taken from the OB showing eYFP expression in axonal fibers (arrows) in the glomerular and external plexiform layers, after injection of AAV-Flex-ChR2-eYFP into raphe. Scale bar, 50 μm. D, Spike raster and rate histogram showing spiking in a presumptive MT cell during inhalation of ambient air and optical stimulation (blue shaded area) in five repeated trials. Spike rate was calculated per 50 ms bin. Top trace (sniff) shows the time course of artificial inhalation. E, Time course of change in firing rate (mean ± SEM; n = 61 units from 9 mice) during optical stimulation (blue bar). The trace indicates change in mean spike rate in 1 s bins relative to the mean rate before stimulation. The time axis is relative to time of stimulation onset. F, Plot of MT cell firing rate averaged for the nine inhalations just before (no stim) and after (stim) optical stimulation for all 61 units. Filled circles indicate units subjected to a unit-by-unit test for significant effects of optical stimulation (5 trials per condition per unit). Open circles indicate units tested with three trials. G, Plot of the amplitude of the inhalation-linked spike burst during inhalation of ambient air (measured as change in firing rate relative to pre-inhalation baseline; see Materials and Methods for details) in the presence and absence of optical stimulation. H, Cumulative probability plot of the effect of optical stimulation on inhalation-linked responses, taken from same data shown in G. Note distribution of increases and decreases in firing rate with a bias toward firing rate increases. I, Same data as in G, with units ordered on the x-axis by the magnitude of their inhalation-linked response without optical stimulation (no stim, filled circles). Effects of optical stimulation (open circles) vary and are not obviously related to the magnitude of the inhalation-linked spike burst. J, Spike rasters and rate histograms showing examples from two units (Ji and Jii) of effects of optically stimulating serotonergic OB afferents on spontaneous activity, measured in the absence of inhalation (no sniff). Note qualitatively different effects in these two units. K, Plot of spontaneous spike rates in the absence (no stim) and presence (stim) of optical stimulation (n = 95 units, 6 mice,) plotted as in F. L, Effects of optical stimulation on baseline MT cell spiking in the absence of inhalation (stim no sniff) versus effects on inhalation-linked spiking (stim sniff) in the same unit, plotted for the subset of the units in I and K in which stimulation effects could be measured under both conditions.
Figure 8.
Figure 8.
Optogenetic activation of serotonergic OB afferents from raphe modestly enhances odor responses in presumptive MT cells. A, Examples of effect of optical stimulation on odorant-evoked responses in two different units. Top, Rate histograms (mean of 5 trials) in the absence of optical stimulation; bottom show the same data with optical stimulation simultaneous with odorant presentation. The first unit (Ai) shows strong odorant-evoked excitation which is increased during stimulation of serotonergic afferents (odorant, isoamyl acetate); the second unit (Aii) shows odorant-evoked suppression of activity, which transforms into excitation during optical stimulation (odorant, ethyl butyrate). B, Plot of odorant-evoked changes in spike rate (Δ spikes/s) in the absence of (no stim) and during (stim) optogenetic stimulation of raphe fibers to the OB. Filled circles indicate units tested with five or more trials in each condition; open circles indicate units tested with three or four trials. C, Time course of change in firing rate caused by optical stimulation (Δ spikes/s with optical stimulation vs without optical stimulation; mean ± SEM across all units). Gray bar indicates timing of optical stimulation. The trace indicates change in mean spike rate in 1 s bins relative to the mean rate before stimulation. Time axis is relative to time of stimulation onset. D, Plot of the amplitude of the inhalation-linked spike burst during inhalation of odorant (measured as change in firing rate relative to pre-inhalation baseline) in the presence and absence of optical stimulation. E, Cumulative probability plot of the effect of optical stimulation on inhalation-linked responses, taken from same data shown in D. F, Effects of optical stimulation on baseline MT cell spiking in the absence of inhalation (“stim effect no sniff”) versus effects on odorant-evoked responses (“stim effect odor”) in the same unit, plotted for the subset of the units in which stimulation effects could be measured under both conditions.

References

    1. Ago Y, Araki R, Tanaka T, Sasaga A, Nishiyama S, Takuma K, Matsuda T. Role of social encounter-induced activation of prefrontal serotonergic systems in the abnormal behaviors of isolation-reared mice. Neuropsychopharmacology. 2013;38:1535–1547. doi: 10.1038/npp.2013.52. - DOI - PMC - PubMed
    1. Akerboom J, Chen TW, Wardill TJ, Tian L, Marvin JS, Mutlu S, Calderón NC, Esposti F, Borghuis BG, Sun XR, Gordus A, Orger MB, Portugues R, Engert F, Macklin JJ, Filosa A, Aggarwal A, Kerr RA, Takagi R, Kracun S, et al. Optimization of a GCaMP calcium indicator for neural activity imaging. J Neurosci. 2012;32:13819–13840. doi: 10.1523/JNEUROSCI.2601-12.2012. - DOI - PMC - PubMed
    1. Banerjee A, Marbach F, Anselmi F, Koh MS, Davis MB, Garcia da Silva P, Delevich K, Oyibo HK, Gupta P, Li B, Albeanu DF. An interglomerular circuit gates glomerular output and implements gain control in the mouse olfactory bulb. Neuron. 2015;87:193–207. doi: 10.1016/j.neuron.2015.06.019. - DOI - PMC - PubMed
    1. Boyd AM, Sturgill JF, Poo C, Isaacson JS. Cortical feedback control of olfactory bulb circuits. Neuron. 2012;76:1161–1174. doi: 10.1016/j.neuron.2012.10.020. - DOI - PMC - PubMed
    1. Boyd AM, Kato HK, Komiyama T, Isaacson JS. Broadcasting of cortical activity to the olfactory bulb. Cell Rep. 2015;10:1032–1039. doi: 10.1016/j.celrep.2015.01.047. - DOI - PMC - PubMed

Publication types

MeSH terms