. 2016 Jun 22;36(25):6836-49.
doi: 10.1523/JNEUROSCI.0067-16.2016.

Adaptive Acceleration of Visually Evoked Smooth Eye Movements in Mice

Affiliations

Adaptive Acceleration of Visually Evoked Smooth Eye Movements in Mice

Takashi Kodama et al. J Neurosci. .

Abstract

The optokinetic response (OKR) consists of smooth eye movements following global motion of the visual surround, which suppress image slip on the retina for visual acuity. The effective performance of the OKR is limited to rather slow and low-frequency visual stimuli, although it can be adaptably improved by cerebellum-dependent mechanisms. To better understand circuit mechanisms constraining OKR performance, we monitored how distinct kinematic features of the OKR change over the course of OKR adaptation, and found that eye acceleration at stimulus onset primarily limited OKR performance but could be dramatically potentiated by visual experience. Eye acceleration in the temporal-to-nasal direction depended more on the ipsilateral floccular complex of the cerebellum than did that in the nasal-to-temporal direction. Gaze-holding following the OKR was also modified in parallel with eye-acceleration potentiation. Optogenetic manipulation revealed that synchronous excitation and inhibition of floccular complex Purkinje cells could effectively accelerate eye movements in the nasotemporal and temporonasal directions, respectively. These results collectively delineate multiple motor pathways subserving distinct aspects of the OKR in mice and constrain hypotheses regarding cellular mechanisms of the cerebellum-dependent tuning of movement acceleration.

Significance statement: Although visually evoked smooth eye movements, known as the optokinetic response (OKR), have been studied in various species for decades, circuit mechanisms of oculomotor control and adaptation remain elusive. In the present study, we assessed kinematics of the mouse OKR through the course of adaptation training. Our analyses revealed that eye acceleration at visual-stimulus onset primarily limited working velocity and frequency range of the OKR, yet could be dramatically potentiated during OKR adaptation. Potentiation of eye acceleration exhibited different properties between the nasotemporal and temporonasal OKRs, indicating distinct visuomotor circuits underlying the two. Lesions and optogenetic manipulation of the cerebellum provide constraints on neural circuits mediating visually driven eye acceleration and its adaptation.

Keywords: adaptation; cerebellum; mouse; optokinetic response.


Figures

Figure 1.
Figure 1.
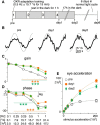
Kinematic features in mouse OKR evoked by 1 s constant-velocity stimulation. A, A part of a raw eye-position trace (top black trace). The mouse was kept in the dark, and visual stimuli were presented by illuminating an optokinetic drum for 1 s (vertical yellow bars). The drum rotated at a constant velocity (30°/s), with alternate changes in direction (bottom blue trace). Gray parts in the eye-position trace contain saccades and erroneous eye-tracking periods (see Material and Methods) that were excluded from the average position and velocity traces shown in B. Positive and negative values in eye position correspond to temporal (T) and nasal (N) eye position, respectively. Eye position of 0° is resting eye position. Positive and negative values in velocity correspond to movements toward the N–T and T–N directions, respectively. All the position and velocity traces in this paper follow this convention. Visual stimuli were binocularly presented in all the experiments in this paper. B, Average eye-position and eye-velocity traces from the data shown in A. The yellow bar indicates the visual stimulation (±30°/s). C, Average of average eye-position (left) and eye-velocity traces (right) from seven animals. Different line colors indicate stimulation velocities (purple, 5°/s; blue, 15°/s; green, 30°/s; yellow, 60°/s; red, 90°/s), which are also shown as numbers to the right of the eye-position traces. Dotted lines indicate zero line. Gray envelop of each trace is SEM. D, Close-up of the OKR onset in the average eye-position trace shown in C, indicating slower onset at stimulation of 5°/s. E–G, I–K, Onset latency (E), eye velocity 0.2 s after the stimulation onset (F), eye-velocity change from 0.2 to 1 s after the stimulation onset (G), deceleration τ (I, J), and rebounding gaze drift (K) are plotted as a function of stimulation velocity (all but J) or stimulation duration (J). Triangles and inverted triangles indicate measurements from the N–T and T–N OKRs, respectively. The colors of the symbols correspond to stimulation velocities as in C. H, Eye-position trace showing the OKR (optokinetic nystagmus) evoked by a prolonged constant-velocity stimulation (30°/s for 20 s). The nystagmus almost ceased in the last half of the stimulation. Error bars, SEM.
Figure 2.
Figure 2.
Changes in sinusoidal OKR after OKR adaptation training. A, OKR adaptation training paradigm, comprising four 15 min training sessions where sinusoidal visual stimulation (0.5 Hz ± 15.7°/s) was presented. After the pretraining recording (pre), mice were placed in a transparent cage at the center of an optokinetic drum, and subjected to the training stimulation with freely moving. Between the training sessions, mice rested for 1 h in their home cages in the dark (gray filled boxes). After the fourth training session, the OKR was examined (day 1). Then mice were returned to the home cages in the dark for ∼17 h until the recording in the following day (day 2). Subsequently, mice were returned to the normal light cycle, and recovery from the adaptation was tested 6 d after the day 2 recording (day 8). B, Average eye-velocity traces of the OKR evoked by sinusoidal stimulation of 0.5 Hz ± 15.7°/s (the same as the training stimulation) from a representative animal. Thick continuous and thin dotted traces are eye and stimulus velocity, respectively. C, D, Average gain [eye-velocity amplitude divided by stimulation-velocity amplitude (C)] and phase (D) of the OKR plotted against different stimulus conditions before (pre, black open circle), immediately after (day 1, filled orange circle), and ∼17 h after the OKR adaptation training (day 2, green diamond, n = 7 mice). Frequency, velocity amplitude, and acceleration amplitude of the stimulation are indicated below the x-axis. Negative value of phase means that eye movements lagged behind the stimulation. Statistical significance of the difference between pretraining values (open circle) and values at day 1 (orange filled circle) or day 2 (green diamond) are shown by lines and asterisks of corresponding colors. E, Average eye-acceleration amplitude plotted against stimulation-acceleration amplitude. Dotted lines are fitted exponential curves. Error bars, SEM.
Figure 3.
Figure 3.
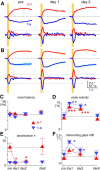
Changes in OKR kinematic features after OKR adaptation training. A, Average eye-position (top) and eye-velocity (bottom) traces of the OKR evoked by constant-velocity stimulation of 30°/s for 0.2 s (yellow bars) from a representative animal. Red and blue traces are the OKRs evoked by stimulation in the N–T and T–N directions, respectively. B, Average of average eye-position (top) and eye-velocity (bottom) traces of the OKR evoked by the brief constant-velocity stimulation from seven animals trained. Light red or blue shading along the traces are SEM. In A and B, horizontal black dotted lines are zero lines. Gray dotted lines are arbitrarily placed to clarify changes of peak velocity after the training. C–F, Changes of onset latency (C), peak eye velocity (D), deceleration τ (E), and rebounding gaze drift (F) over the course of the adaptation training. These kinematic features were measured from the OKR evoked by 0.2 s constant-velocity stimulation at 30°/s. Red triangles and blue inverted triangles indicate measurements from the N–T and T–N OKRs, respectively. Statistical significance of the difference from pretraining values are indicated by asterisks in corresponding colors. Horizontal dotted lines are arbitrarily placed to clarify changes from pretraining values. Error bars, SEM.
Figure 4.
Figure 4.
The N–T and T–N OKRs are independently adaptable. A, Training stimulation for unidirectional OKR adaptation. Velocity of an optokinetic drum was sinusoidally modulated between 0 and 31.4°/s at 0.5 Hz (left bottom graph), which unidirectionally moved the drum position (left top graph). When the training stimulation is counterclockwise, the N–T OKR in the left eye and the T–N OKR in the right eye were trained by the stimulation, whereas the OKR toward the other direction was left untrained, as illustrated in the right panel. The training paradigm except for the training stimulation was the same as shown in Figure 2A. B, C, Average of average eye-position (the first and third rows) and eye-velocity (the second and fourth rows) traces of the OKRs evoked by 0.2 s constant-velocity stimulation at 30°/s (n = 8 mice). Traces were shown in the same way as in Figure 3A, B. B and C show results from the eyes that were trained by the N–T (A, left eye) and T–N (A, right eye) stimulation, respectively. D–G, Changes of peak eye velocity (D), deceleration τ (E), rebounding gaze drift (F), and onset latency (G) over the course of the adaptation training. These kinematic features were measured from the OKRs evoked by 0.2 s constant-velocity stimulation at 30°/s. Graphs are organized in the same way as Figure 3C–F. Left and right graphs show results from the eye trained by the N–T and T–N stimulation, respectively.
Figure 5.
Figure 5.
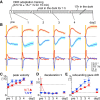
The changes in OKR kinematic features follow distinct time courses during OKR adaptation. A, Schematic illustration of the training and recording schedule. The OKR to 0.2 s constant-velocity stimulation at 30°/s was measured after every 15 min training session (1–4) as well as before the first training session (pre) and 17 h after the last training session (day 2). The training was by sinusoidal stimulation of 0.5 Hz ± 15.7°/s under the head-fixed condition. B, Average of average eye-position (top) and eye-velocity (bottom) traces of the OKRs evoked by 0.2 s constant-velocity stimulation (30°/s) at different times in the training (n = 7 mice). Traces were shown in the same way as in Figure 3A, B. C–E, Changes of peak eye velocity (C), deceleration τ (D), and rebounding gaze drift (E) over the course of the adaptation training. These kinematic features were measured from the OKRs evoked by 0.2 s constant-velocity stimulation at 30°/s. Graphs are organized in the same way as Figure 3C–F.
Figure 6.
Figure 6.
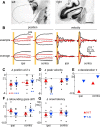
Changes in OKR kinematics after unilateral flocculectomy. A, Representative Nissl images of coronal cerebellar sections of lesioned (left) and intact side (right). Dotted line shows contour of presumed location of the lesioned floccular complex. The image of the intact side is horizontally flipped for comparison with the flocculectomized side. Scale bar, 500 μm. B, The OKRs evoked by 0.2 s constant-velocity stimulation at 30°/s before (black) and 2 d after unilateral flocculectomy (red). The left two and right two columns show eye-position and eye-velocity traces, respectively. The sides of recorded eyes are indicated on the bottom. The top row shows average traces from an example mouse. The bottom row is average of average traces from eight flocculectomized mice, where gray shading along the traces are SEM. Yellow bars indicate visual stimulation. C–G, Difference of eye position measured 2 s after the stimulation (C), peak eye velocity (D), deceleration τ (E), rebounding gaze drift (F), and onset latency (G) between before and 2 d after unilateral flocculectomy. Red triangles and blue inverted triangles indicate measurements from the N–T and T–N OKRs, respectively. Small black dots indicate measurements from individual animals. Note that deceleration τ was estimated from average of average velocity traces shown in the bottom row of B.
Figure 7.
Figure 7.
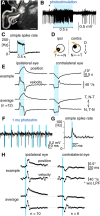
Eye movements evoked by PC-specific excitation using optogenetics. A, Representative fluorescent image of a coronal cerebellar section of an Pcp2-Cre;Ai27 mouse, showing the flocculus (F), paraflocculus (PF), and the track of the implanted optical fiber (dotted yellow line). The tip of the optical fiber was placed on the PC axonal bundles emerging from the parafloccular region of the floccular complex. Scale bar, 500 μm. B, An example of extracellular recording of a PC with axonal photostimulation via the implanted optical fiber. A continuous 0.5 s pulse of blue light (blue rectangle) excited PCs, which was followed by a pause of firing. A complex spike (*) verifies that the recording was from a PC. C, Average peristimulus histogram showing firing rate changes of PCs (n = 59) in response to 0.5 s light pulse. Bin, 2 ms. D, Schematic summary of eye movements evoked by unilateral photoexcitation of floccular complex PCs. N, Nasal; T, temporal; D, dorsal; V, ventral. E, Horizontal eye movements evoked by unilateral PC photoexcitation with 0.5 s light pulse (blue bars). Left and right columns show movements of the ipsilateral and contralateral eyes, respectively. The top two traces show average eye-position and eye-velocity traces from a representative animal. The bottom two traces are average of average eye-position and eye-velocity traces from 12 animals, where gray shading along traces are SEM. F, Extracellular recording of a PC during photostimulation by a train of 1 ms light pulses. Each 1 ms light pulse elicits at most one spike. G, Average peristimulus histogram showing firing-rate changes of PCs (n = 25) in response to 1 ms light pulse. Firing rate transiently increases for ∼15 ms after the light pulse, which was not followed by firing inhibition or pause. Bin, 2 ms. H, Horizontal eye movements evoked by unilateral PC photoexcitation with 1 ms light pulse (blue lines). The graphs are organized in the same way as in E. Average of average eye-position and eye-velocity traces for the ipsilateral and contralateral eyes were made from 10 and 6 mice, respectively. For better temporal resolution of the onset response, eye-velocity traces shown were not low-pass filtered. Note that eye-movement onset timing accuracy is potentially compromised by a transport delay of the video-oculography system (range: 2.05–3.75 ms).
Figure 8.
Figure 8.
Eye movements evoked by PC-specific inhibition using optogenetics. A, Extracellular recording of a PC with somatodendritic photostimulation via subdermally placed optical fiber. A continuous 0.5 s pulse of blue light (blue rectangle) silenced PC firing. A complex spike (*) verifies that the recording was from a PC. B, Average peristimulus histogram showing firing-rate changes of PCs (n = 19) in response to 0.5 s light pulse. Bottom, Firing-rate changes at onset (left) and offset (right) of photostimulation are magnified, where gray shading along traces are SEM. Bin, 2 ms. C, Horizontal eye position (left) and velocity (right) evoked by unilateral PC photoinhibition with 0.5 s light pulse (blue bars), measured in the eye ipsilateral to the stimulated side. The graphs are organized in the same way as in Figure 7E.
Figure 9.
Figure 9.
Summarized OKR circuit from the retina to the lateral rectus. Circled letters in the MVN and NPH indicate neuronal types. A, MVN inhibitory premotor neuron. B, MVN excitatory premotor neuron. C, NPH excitatory premotor neuron. D, NPH inhibitory premotor neuron. Green dots in the MVN indicate degree of floccular complex PC innervation. Looped arrows on NPH excitatory premotor neuron (C) express positive feedback through excitatory recurrent network, implementing velocity-position neural integration for gaze-holding. For simplicity, only nuclei and cell types likely to play major roles in the OKR to the clockwise visual stimulation are shown; commissural projections and pathways to the oculomotor nucleus and the medial rectus are omitted. Numbers on lines indicate references anatomically and/or electrophysiologically reporting the projections. Note that references are preferentially selected for mice and the list of references is not comprehensive due to limited space: 1, Dhande et al., 2013; 2, Terasawa et al., 1979; 3, Cazin et al., 1984; 4, Schmidt et al., 1995; 5, Blanks et al., 1983; 6, Schonewille et al., 2006; 7, Shin et al., 2011; 8, Escudero et al., 1992; 9, Lee et al., 2015. LR, lateral rectus; NOT, nucleus of optic tract; DTN, dorsal terminal nucleus; NRTP, nucleus reticularis tegmenti pontis; IO, inferior olive; PC, Purkinje cell; NPH, nucleus prepositus hypoglossi; MVN, medial vestibular nucleus.

Similar articles

Cited by

References

    1. Andreescu CE, Ruiter MM, De Zeeuw CI, De Jeu MT. Otolith deprivation induces optokinetic compensation. J Neurophysiol. 2005;94:3487–3496. doi: 10.1152/jn.00147.2005. - DOI - PubMed
    1. Aziz W, Wang W, Kesaf S, Mohamed AA, Fukazawa Y, Shigemoto R. Distinct kinetics of synaptic structural plasticity, memory formation, and memory decay in massed and spaced learning. Proc Natl Acad Sci U S A. 2014;111:E194–E202. doi: 10.1073/pnas.1303317110. - DOI - PMC - PubMed
    1. Barmack NH, Pettorossi VE. Effects of unilateral lesions of the flocculus on optokinetic and vestibuloocular reflexes of the rabbit. J Neurophysiol. 1985;53:481–496. - PubMed
    1. Barski JJ, Dethleffsen K, Meyer M. Cre recombinase expression in cerebellar Purkinje cells. Genesis. 2000;28:93–98. doi: 10.1002/1526-968X(200011/12)28:3/4%3C93::AID-GENE10%3E3.0.CO%3B2-W. - DOI - PubMed
    1. Beraneck M, Cullen KE. Activity of vestibular nuclei neurons during vestibular and optokinetic stimulation in the alert mouse. J Neurophysiol. 2007;98:1549–1565. doi: 10.1152/jn.00590.2007. - DOI - PubMed

Publication types

MeSH terms

LinkOut - more resources