. 2016 Jun 7;11(1):9.
doi: 10.1186/s13021-016-0050-0. eCollection 2016 Dec.

Spatially explicit analysis of field inventories for national forest carbon monitoring

Affiliations

Spatially explicit analysis of field inventories for national forest carbon monitoring

David C Marvin et al. Carbon Balance Manag. .

Abstract

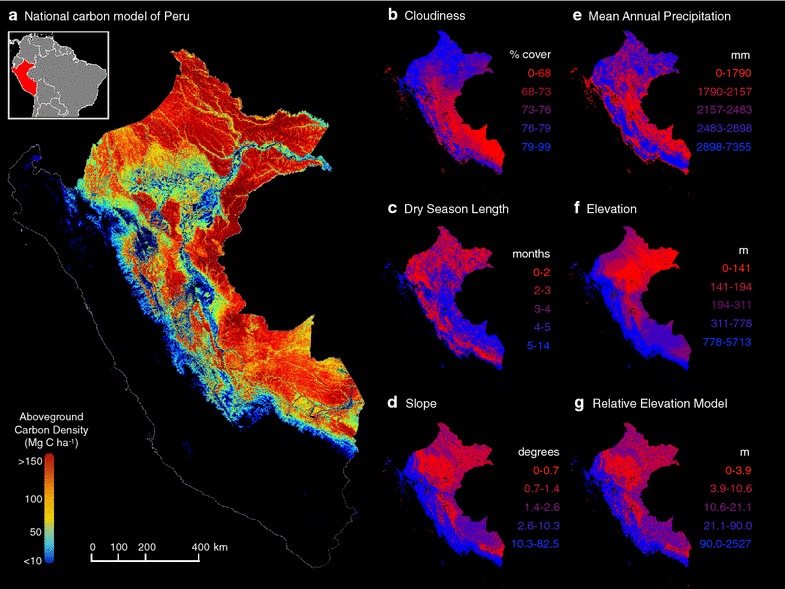
Background: Tropical forests provide a crucial carbon sink for a sizable portion of annual global CO2 emissions. Policies that incentivize tropical forest conservation by monetizing forest carbon ultimately depend on accurate estimates of national carbon stocks, which are often based on field inventory sampling. As an exercise to understand the limitations of field inventory sampling, we tested whether two common field-plot sampling approaches could accurately estimate carbon stocks across approximately 76 million ha of Perúvian forests. A 1-ha resolution LiDAR-based map of carbon stocks was used as a model of the country's carbon geography.

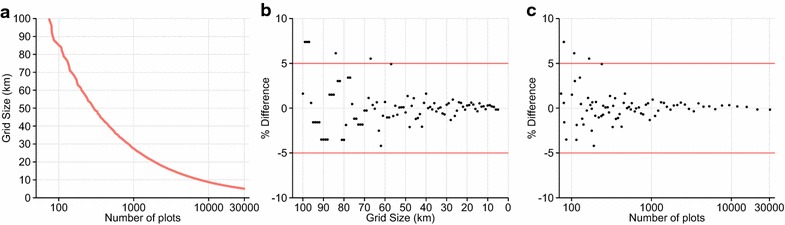
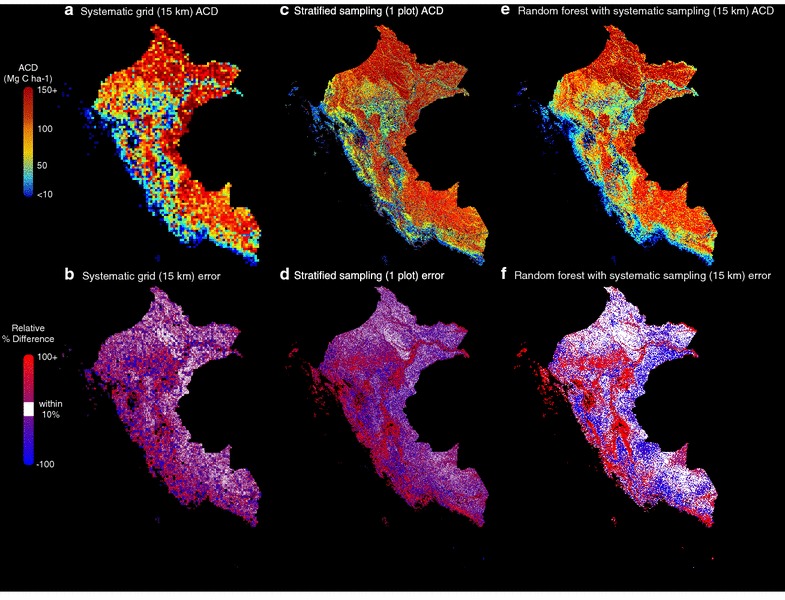
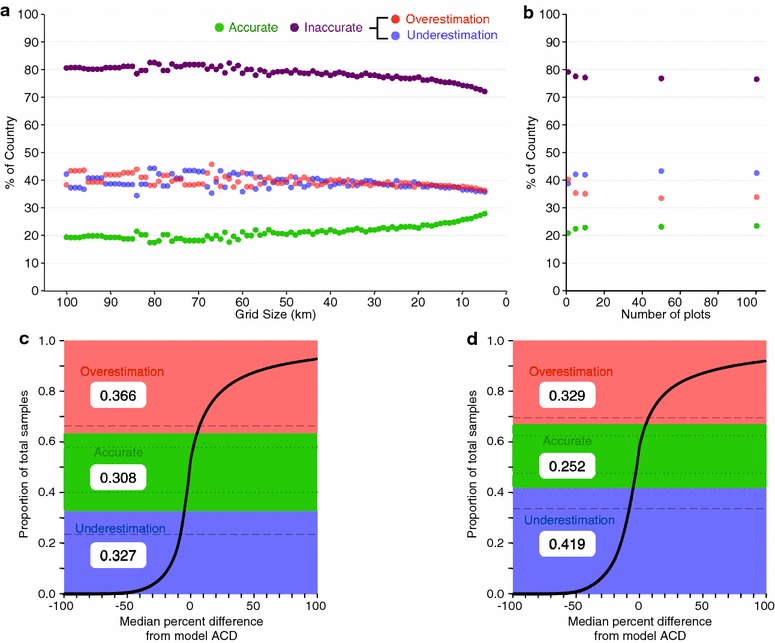
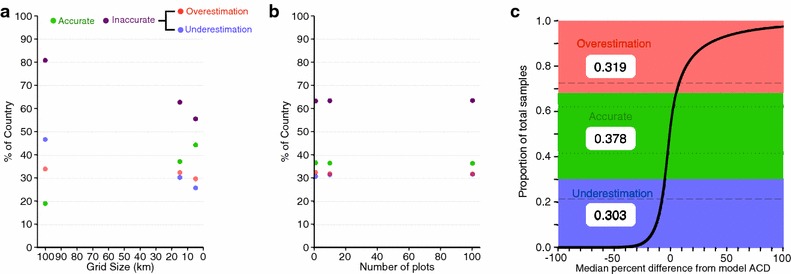
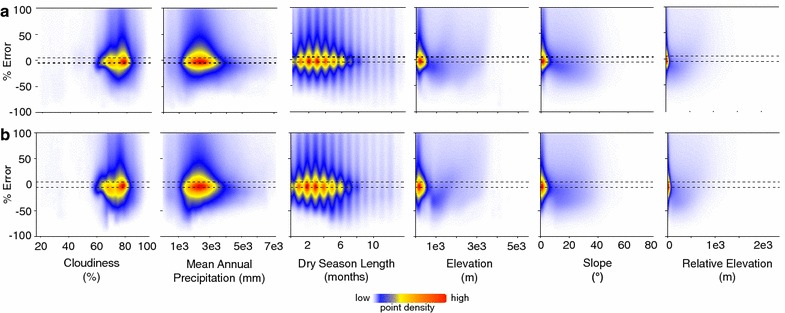
Results: Both field inventory sampling approaches worked well in estimating total national carbon stocks, almost always falling within 10 % of the model national total. However, the sampling approaches were unable to produce accurate spatially-explicit estimates of the carbon geography of Perú, with estimates falling within 10 % of the model carbon geography across no more than 44 % of the country. We did not find any associations between carbon stock errors from the field plot estimates and six different environmental variables.

Conclusions: Field inventory plot sampling does not provide accurate carbon geography for a tropical country with wide ranging environmental gradients such as Perú. The lack of association between estimated carbon errors and environmental variables suggests field inventory sampling results from other nations would not differ from those reported here. Tropical forest nations should understand the risks associated with primarily field-based sampling approaches, and consider alternatives leading to more effective forest conservation and climate change mitigation.

Keywords: Carnegie Airborne Observatory; Field sampling; Forest carbon stocks; Tropical forest.


Figures

Fig. 1
Fig. 1
Maps used for the analyses. a The model aboveground carbon density (ACD) map of Perú at 1-ha resolution with all non-forested areas masked out (adapted from [6]), and the strata binned and colored by quintiles for b cloudiness, c dry season length, d slope, e mean annual precipitation, f elevation and g relative elevation (see “Methods” section)
Fig. 2
Fig. 2
National total carbon stock estimation using systematic grid sampling showing a the relationship between the sampling grid dimensions and number of 1-ha field plots, b the percent difference between total field plot estimated and total model national carbon stocks by grid size and c same as in b but with the number of plots required by the grid sampling on the x-axis (log scale)
Fig. 3
Fig. 3
Results of the sampling and upscaling. a Estimated ACD using a 15 km systematic grid sampling approach, b percent relative difference between model ACD (from Fig. 1a) and a, c ACD using a 1-plot stratified sampling approach, d percent relative difference between model ACD and c, e ACD using random forest upscaling trained with 15 km systematic sampling grid and f percent relative difference between model ACD and (e)
Fig. 4
Fig. 4
Accuracy assessment of plot sampling when using stratify-and-multiply upscaling to within at least 10 % of the model ACD using a systematic grid sampling and b stratified random sampling with same legend as in (a). The empirical cumulative distribution of the percent relative difference between the model ACD and the median estimated ACD error across c all systematic sampling grids and d all stratified random sampling plot sets (see ‘‘Methods’’ section). The coloring in c, d show the proportions that overestimate (red), underestimate (blue), and correctly estimate (green) within 10 % of the model ACD value. Horizontal broken lines in c, d show how the proportion correctly estimated would change with a more stringent (5 %, dotted lines) or less stringent (15 %, dashed line) error threshold
Fig. 5
Fig. 5
Accuracy assessment of plot sampling when using model-linked (random forest) upscaling to within at least 10 % of the model ACD using a systematic grid sampling and b stratified random sampling with same legend as in (a). The empirical cumulative distribution of the percent relative difference between the model ACD and the median estimated ACD error across c all systematic sampling grids and all stratified random sampling plot sets (see ‘‘Methods’’ section). The coloring in c show the proportions that overestimate (red), underestimate (blue), and correctly estimate (green) within 10 % of the model ACD value, and horizontal broken lines show how the proportion correctly estimated would change with a more stringent (5 %, dotted lines) or less stringent (15 %, dashed line) error threshold
Fig. 6
Fig. 6
Results of the uncertainty simulations. a Number of field plots needed to reliably (pr=0.9, red line) estimate the mean ACD (Mg C ha−1) of a substratum using quintile binning (note: a random selection of 1000 substrata are plotted for clarity). b Frequency distribution of the number of field plots needed to reliably estimate a substratum’s mean ACD. Same as in a but colored by the substratum’s c mean ACD, d elevation and e slope. Further topographic and climatic variables are shown in Additional file 1: Fig. S3
Fig. 7
Fig. 7
Underlying drivers of uncertainty. The percent relative difference between the model ACD and the median estimated ACD error across a all systematic sampling grids and b all stratified random sampling plot sets (see ‘‘Methods’’ section), plotted against each non-binned stratum at the 1-ha scale. Plots are composed of a randomly selected 10 % of the total dataset (approximately 7.6 million hectares), with the point density color scale on a square root transformation for plotting clarity. Horizontal dashed black lines show the 10 % accuracy range

References

    1. Pan Y, Birdsey RA, Fang J, Houghton R, Kauppi PE, Kurz WA, Phillips OL, Shvidenko A, Lewis SL, Canadell JG, Ciais P, Jackson RB, Pacala SW, McGuire AD, Piao S, Rautiainen A, Sitch S, Hayes D. A large and persistent carbon sink in the world’s forests. Science. 2011;333:988–993. doi: 10.1126/science.1201609. - DOI - PubMed
    1. LeQuere C, Moriarty R, Andrew RM, Peters GP, Ciais P, Friedlingstein P, Jones SD, Sitch S, Tans P, Arneth A, Boden TA, Bopp L, Bozec Y, Canadell JG, Chevallier F, Cosca CE, Harris I, Hoppema M, Houghton RA, House JI, Jain A, Johannessen T, Kato E, Keeling RF, Kitidis V, KleinGoldewijk K, Koven C, Landa CS, Landschützer P, Lenton A, et al. Global carbon budget 2014. Earth Syst Sci Data Discuss. 2014;7:521–610. doi: 10.5194/essdd-7-521-2014. - DOI
    1. CDIAC: Global carbon project: Full global carbon budget. US. Department of Energy; 2012.
    1. Köhl M, Baldauf T, Plugge D, Krug J. Reduced emissions from deforestation and forest degradation (REDD): a climate change mitigation strategy on a critical track. Carbon Balance Manag. 2009;4:10. doi: 10.1186/1750-0680-4-10. - DOI - PMC - PubMed
    1. REDD Offset Working Group: California, Acre and Chiapas: partnering to reduce emissions from tropical deforestation. Green Technology Leadership Group; 2012.

LinkOut - more resources