

Stimulus and optode placement effects on functional near-infrared spectroscopy of visual cortex
- PMID: 27335887
- PMCID: PMC4909057
- DOI: 10.1117/1.NPh.3.2.025005
Stimulus and optode placement effects on functional near-infrared spectroscopy of visual cortex
Abstract
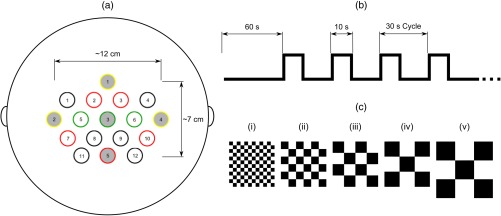
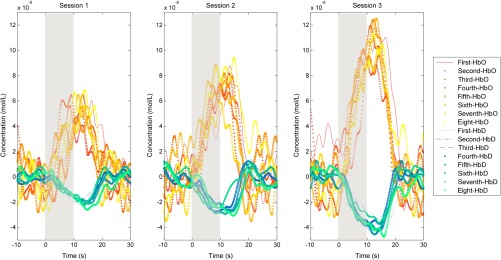
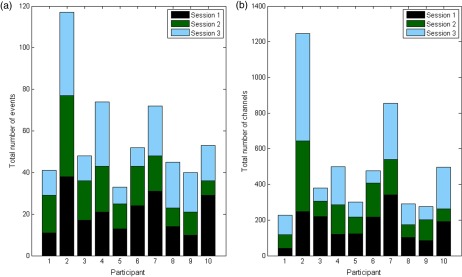
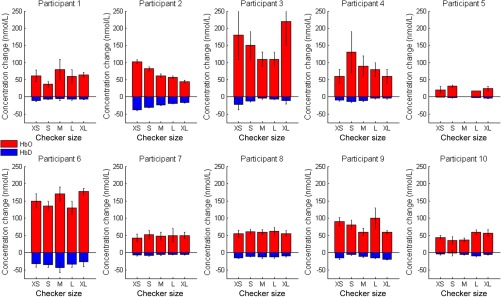
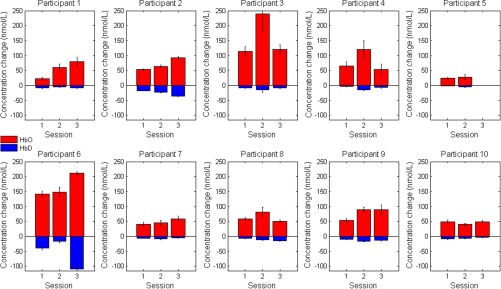
Functional near-infrared spectroscopy has yet to be implemented as a stand-alone technique within an ophthalmology clinical setting, despite its promising advantages. The present study aims to further investigate reliability of visual cortical signals. This was achieved by: (1) assessing the effects of optode placements using the 10-20 International System of Electrode Placement consisting of 28 channels, (2) determining effects of stimulus size on response, and (3) evaluating response variability as a result of cap placement across three sessions. Ten participants with mean age [Formula: see text] years (five male) and varying types of hair color and thickness were recruited. Visual stimuli of black-and-white checkerboards, reversing at a frequency of 7.5 Hz were presented. Visual angles of individual checker squares included 1 deg, 2 deg, 5 deg, 9 deg, and 18 deg. The number of channels that showed response was analyzed for each participant, stimulus size, and session. 1-deg stimulus showed the greatest activation. One of three data collection sessions for each participant gave different results ([Formula: see text]). Hair color and thickness each had an effect upon the overall HbO ([Formula: see text]), while only color had a significant effect for HbD ([Formula: see text]). A reliable level of robustness and consistency is still required for clinical implementation and assessment of visual dysfunction.
Keywords: functional near-infrared spectroscopy; near infrared spectroscopy; visual cortex; visual stimulation.
Figures
Similar articles
-
Somatic stimulation causes frontoparietal cortical changes in neonates: a functional near-infrared spectroscopy study.Neurophotonics. 2017 Jan;4(1):011004. doi: 10.1117/1.NPh.4.1.011004. Epub 2016 Aug 17. Neurophotonics. 2017. PMID: 27570791 Free PMC article.
-
Hand-grasping and finger tapping induced similar functional near-infrared spectroscopy cortical responses.Neurophotonics. 2016 Apr;3(2):025006. doi: 10.1117/1.NPh.3.2.025006. Epub 2016 Jun 15. Neurophotonics. 2016. PMID: 27335888 Free PMC article.
-
Image reconstruction of oxidized cerebral cytochrome C oxidase changes from broadband near-infrared spectroscopy data.Neurophotonics. 2017 Apr;4(2):021105. doi: 10.1117/1.NPh.4.2.021105. Epub 2017 May 24. Neurophotonics. 2017. PMID: 28560239 Free PMC article.
-
Absolute quantification of oxygenated hemoglobin within the visual cortex with functional near infrared spectroscopy (fNIRS).Invest Ophthalmol Vis Sci. 2010 Sep;51(9):4856-60. doi: 10.1167/iovs.09-4940. Epub 2010 Mar 31. Invest Ophthalmol Vis Sci. 2010. PMID: 20357203 Clinical Trial.
-
[Physiology and pathology of visual information processing].Nippon Ganka Gakkai Zasshi. 2007 Mar;111(3):160-91; discussion 192. Nippon Ganka Gakkai Zasshi. 2007. PMID: 17402561 Review. Japanese.
Cited by
-
Phasic and repetitive self-touch differ in hemodynamic response in the prefrontal cortex-An fNIRS study.Front Neuroergon. 2023 Nov 29;4:1266439. doi: 10.3389/fnrgo.2023.1266439. eCollection 2023. Front Neuroergon. 2023. PMID: 38234502 Free PMC article.
-
Most favorable stimulation duration in the sensorimotor cortex for fNIRS-based BCI.Biomed Opt Express. 2021 Sep 2;12(10):5939-5954. doi: 10.1364/BOE.434936. eCollection 2021 Oct 1. Biomed Opt Express. 2021. PMID: 34745714 Free PMC article.
-
Utilizing functional near-infrared spectroscopy for prediction of cognitive workload in noisy work environments.Neurophotonics. 2017 Oct;4(4):041406. doi: 10.1117/1.NPh.4.4.041406. Epub 2017 Aug 18. Neurophotonics. 2017. PMID: 28840158 Free PMC article.
-
Monitoring the haemodynamic response to visual stimulation in glaucoma patients.Sci Rep. 2021 Jun 30;11(1):13567. doi: 10.1038/s41598-021-92857-x. Sci Rep. 2021. PMID: 34193904 Free PMC article. Clinical Trial.
References
-
- Tang L., Avison M. J., Gore J. C., “Nonlinear blood oxygen level-dependent responses for transient activations and deactivations in V1 insights into the hemodynamic response function with the balloon model,” Magn. Reson. Imaging 27(4), 449–459 (2009).MRIMDQ10.1016/j.mri.2008.07.017 - DOI - PMC - PubMed
LinkOut - more resources
Full Text Sources
Other Literature Sources
Miscellaneous
