

Hand-grasping and finger tapping induced similar functional near-infrared spectroscopy cortical responses
- PMID: 27335888
- PMCID: PMC4909125
- DOI: 10.1117/1.NPh.3.2.025006
Hand-grasping and finger tapping induced similar functional near-infrared spectroscopy cortical responses
Abstract
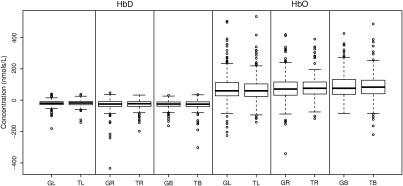
Despite promising advantages such as low cost and portability of functional near-infrared spectroscopy (fNIRS), it has yet to be widely implemented outside of basic research. Specifically, fNIRS has yet to be proven as a standalone tool within a clinical setting. The objective of this study was to assess hemodynamic concentration changes at the primary and premotor motor cortices as a result of simple whole-hand grasping and sequential finger-opposition (tapping) tasks. These tasks were repeated over 3 days in a randomized manner. Ten healthy young adults ([Formula: see text]) participated in the study. Quantitatively, no statistically significant differences were discovered between the levels of activation for the two motor tasks ([Formula: see text]). Overall, the signals were consistent across all 3 days. The findings show that both finger-opposition and hand grasping can be used interchangeably in fNIRS for assessment of motor function which would be useful in further advancing techniques for clinical implementation.
Keywords: finger tapping; functional near-infrared spectroscopy; hand grasping; motor cortex; motor stimulation; near-infrared spectroscopy.
Figures


Similar articles
-
Effective Connectivity of Cortical Sensorimotor Networks During Finger Movement Tasks: A Simultaneous fNIRS, fMRI, EEG Study.Brain Topogr. 2016 Sep;29(5):645-60. doi: 10.1007/s10548-016-0507-1. Epub 2016 Jul 20. Brain Topogr. 2016. PMID: 27438589
-
Enhancing classification accuracy of fNIRS-BCI using features acquired from vector-based phase analysis.J Neural Eng. 2020 Oct 15;17(5):056025. doi: 10.1088/1741-2552/abb417. J Neural Eng. 2020. PMID: 33055382
-
Task complexity relates to activation of cortical motor areas during uni- and bimanual performance: a functional NIRS study.Neuroimage. 2009 Jul 15;46(4):1105-13. doi: 10.1016/j.neuroimage.2009.03.027. Epub 2009 Mar 21. Neuroimage. 2009. PMID: 19306929
-
A Systematic Review of Integrated Functional Near-Infrared Spectroscopy (fNIRS) and Transcranial Magnetic Stimulation (TMS) Studies.Front Neurosci. 2019 Feb 28;13:84. doi: 10.3389/fnins.2019.00084. eCollection 2019. Front Neurosci. 2019. PMID: 30872985 Free PMC article.
-
[Clinical application of functional near-infrared spectroscopy in rehabilitation medicine].Brain Nerve. 2010 Feb;62(2):125-32. Brain Nerve. 2010. PMID: 20192032 Review. Japanese.
Cited by
-
Laterality Index Calculations in a Control Study of Functional Near Infrared Spectroscopy.Brain Topogr. 2023 Mar;36(2):210-222. doi: 10.1007/s10548-023-00942-3. Epub 2023 Feb 9. Brain Topogr. 2023. PMID: 36757503
-
Assessment of age-related decline of neurovascular coupling responses by functional near-infrared spectroscopy (fNIRS) in humans.Geroscience. 2019 Oct;41(5):495-509. doi: 10.1007/s11357-019-00122-x. Epub 2019 Nov 2. Geroscience. 2019. PMID: 31676966 Free PMC article. Review.
-
Comparison of functional activation responses from the auditory cortex derived using multi-distance frequency domain and continuous wave near-infrared spectroscopy.Neurophotonics. 2021 Oct;8(4):045004. doi: 10.1117/1.NPh.8.4.045004. Epub 2021 Dec 15. Neurophotonics. 2021. PMID: 34926716 Free PMC article.
-
Mapping cortical network effects of fatigue during a handgrip task by functional near-infrared spectroscopy in physically active and inactive subjects.Neurophotonics. 2019 Oct;6(4):045011. doi: 10.1117/1.NPh.6.4.045011. Epub 2019 Dec 10. Neurophotonics. 2019. PMID: 31853458 Free PMC article.
-
A working hypothesis visualization method for fNIRS measurements using Monte Carlo simulation.MethodsX. 2023 Sep 9;11:102357. doi: 10.1016/j.mex.2023.102357. eCollection 2023 Dec. MethodsX. 2023. PMID: 37727580 Free PMC article.
References
-
- Martini F., Nath J. L., Anatomy and Physiology, 2nd ed., Benjamin Cummings, San Francisco: (2010).
-
- Dormer C., Ward T., McLoone S., “Towards enhanced biofeedback mechanisms for upper limb rehabilitation in stroke,” in 6th European Symp. Biomedical Engineering, Crete, Greece (2008).
LinkOut - more resources
Full Text Sources
Other Literature Sources
