Review
. 2016 Oct;3(4):041805.
doi: 10.1117/1.NPh.3.4.041805. Epub 2016 Jun 3.

Counting numbers of synaptic proteins: absolute quantification and single molecule imaging techniques

Affiliations
Review

Counting numbers of synaptic proteins: absolute quantification and single molecule imaging techniques

Angela Patrizio et al. Neurophotonics. 2016 Oct.

Abstract

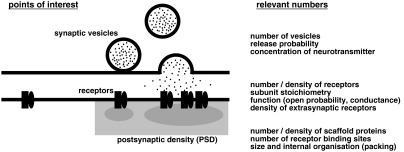
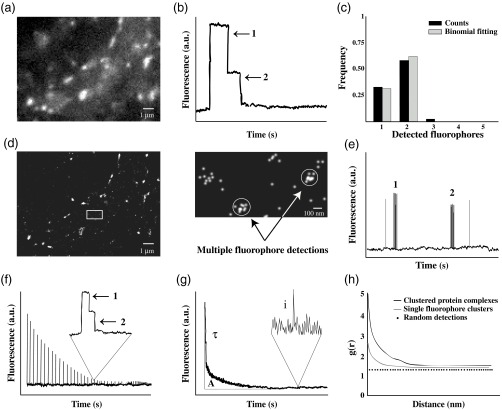
The ability to count molecules is essential to elucidating cellular mechanisms, as these often depend on the absolute numbers and concentrations of molecules within specific compartments. Such is the case at chemical synapses, where the transmission of information from presynaptic to postsynaptic terminals requires complex interactions between small sets of molecules. Be it the subunit stoichiometry specifying neurotransmitter receptor properties, the copy numbers of scaffold proteins setting the limit of receptor accumulation at synapses, or protein packing densities shaping the molecular organization and plasticity of the postsynaptic density, all of these depend on exact quantities of components. A variety of proteomic, electrophysiological, and quantitative imaging techniques have yielded insights into the molecular composition of synaptic complexes. In this review, we compare the different quantitative approaches and consider the potential of single molecule imaging techniques for the quantification of synaptic components. We also discuss specific neurobiological data to contextualize the obtained numbers and to explain how they aid our understanding of synaptic structure and function.

Keywords: pair correlation analysis; photoactivated localization microscopy; single molecule localization microscopy; stochastic optical reconstruction microscopy.


Figures

Fig. 1
Fig. 1
Where numbers count: quantitative parameters of synaptic components. Synaptic transmission ultimately depends on the activity of postsynaptic receptor complexes. The release of neurotransmitters from the presynaptic terminal controls the activation of these receptors, whereas scaffold proteins in the PSD regulate their number and subsynaptic distribution. Precise knowledge of the relevant parameters can help model the underlying molecular mechanisms on a quantitative level.
Fig. 2
Fig. 2
Molecule counting using conventional and single molecule imaging. (a) Conventional fluorescence microscopy of a dissociated hippocampal neuron expressing Dendra2-tagged GABAARγ2. (b) Idealized representation of an intensity-time trace displaying photobleaching steps. (c) Histogram of fluorophore counts (black bars) and data fitting with a binomial distribution corresponding to two fluorophores and a probability of detection pd of 80% (gray). Note that some overcounting may occur in these experiments. The counts have been corrected for missed events where both fluorophores are inactive (0.2×0.2=0.04). (d) Pointillist image of Dendra2-GABAARγ2 detections of the neuron shown in (a). Clusters of detections belonging to the same molecule can be spatially resolved in sparse areas (inset). (e) Illustration of a time trace of PALM detections. Bursts of detections originating from different fluorophores can be separated temporally to determine molecule numbers. The number of bursts can be fitted with a binomial distribution to account for the photoactivation efficiency of the fluorophore [as in (c)]. (f) Pulsed photoconversion of subsets of fluorophores in a dense structure. Steps in the decay traces correspond to the bleaching of single fluorophores [as in (b)]. The total number of fluorophores can be calculated as the sum of the peak intensities expressed in absolute numbers. (g) Quantitative analysis of fluorescence decay kinetics. The number of molecules in a dense structure can be calculated as N=A/(iτ), where A is the area under the curve (total intensity of the structure), i is the average intensity of individual fluorophores, and τ is the lifetime of the fluorophores. (h) Pair correlation analysis of the spatial distribution of fluorophores. Deviations from a random distribution (dots) identify clustering due to recurrent fluorophore detections (gray) or the presence of protein complexes (black curve) at characteristic distances.

References

    1. Ribrault C., Sekimoto K., Triller A., “From the stochasticity of molecular processes to the variability of synaptic transmission,” Nat. Rev. Neurosci. 12(7), 375–387 (2011). 10.1038/nrn3025 - DOI - PubMed
    1. Okabe S., “Molecular anatomy of the postsynaptic density,” Mol. Cell. Neurosci. 34(4), 503–518 (2007). 10.1016/j.mcn.2007.01.006 - DOI - PubMed
    1. Fisher-Lavie A., Ziv N. E., “Matching dynamics of presynaptic and postsynaptic scaffolds,” J. Neurosci. 33(32), 13094–13100 (2013). 10.1523/JNEUROSCI.2144-13.2013 - DOI - PMC - PubMed
    1. Levy J. M., et al. , “Synaptic consolidation normalizes AMPAR quantal size following MAGUK loss,” Neuron 87(3), 534–548 (2015). 10.1016/j.neuron.2015.07.015 - DOI - PMC - PubMed
    1. Paoletti P., Bellone C., Zhou Q., “NMDA receptor subunit diversity: impact on receptor properties, synaptic plasticity and disease,” Nat. Rev. Neurosci. 14(6), 383–400 (2013). 10.1038/nrn3504 - DOI - PubMed