

Prediction and Quantification of Individual Athletic Performance of Runners
- PMID: 27336162
- PMCID: PMC4919094
- DOI: 10.1371/journal.pone.0157257
Prediction and Quantification of Individual Athletic Performance of Runners
Abstract
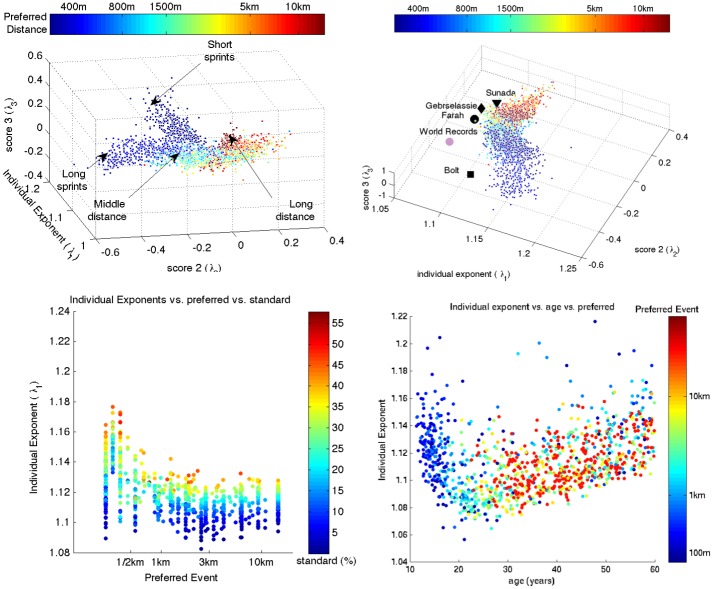
We present a novel, quantitative view on the human athletic performance of individual runners. We obtain a predictor for running performance, a parsimonious model and a training state summary consisting of three numbers by application of modern validation techniques and recent advances in machine learning to the thepowerof10 database of British runners' performances (164,746 individuals, 1,417,432 performances). Our predictor achieves an average prediction error (out-of-sample) of e.g. 3.6 min on elite Marathon performances and 0.3 seconds on 100 metres performances, and a lower error than the state-of-the-art in performance prediction (30% improvement, RMSE) over a range of distances. We are also the first to report on a systematic comparison of predictors for running performance. Our model has three parameters per runner, and three components which are the same for all runners. The first component of the model corresponds to a power law with exponent dependent on the runner which achieves a better goodness-of-fit than known power laws in the study of running. Many documented phenomena in quantitative sports science, such as the form of scoring tables, the success of existing prediction methods including Riegel's formula, the Purdy points scheme, the power law for world records performances and the broken power law for world record speeds may be explained on the basis of our findings in a unified way. We provide strong evidence that the three parameters per runner are related to physiological and behavioural parameters, such as training state, event specialization and age, which allows us to derive novel physiological hypotheses relating to athletic performance. We conjecture on this basis that our findings will be vital in exercise physiology, race planning, the study of aging and training regime design.
Conflict of interest statement
Figures


Similar articles
-
Technological advances in elite marathon performance.J Appl Physiol (1985). 2021 Jun 1;130(6):2002-2008. doi: 10.1152/japplphysiol.00002.2021. Epub 2021 May 13. J Appl Physiol (1985). 2021. PMID: 33982594
-
Pacing and packing behaviour in elite and world record performances at Berlin marathon.Eur J Sport Sci. 2023 Aug;23(8):1472-1479. doi: 10.1080/17461391.2022.2111278. Epub 2022 Aug 28. Eur J Sport Sci. 2023. PMID: 35942622
-
Validity of the Wingate anaerobic test for the evaluation of elite runners.J Strength Cond Res. 2011 Mar;25(3):819-24. doi: 10.1519/JSC.0b013e3181c1fa71. J Strength Cond Res. 2011. PMID: 20512066
-
Contemporary Nutrition Strategies to Optimize Performance in Distance Runners and Race Walkers.Int J Sport Nutr Exerc Metab. 2019 Mar 1;29(2):117-129. doi: 10.1123/ijsnem.2019-0004. Epub 2019 Apr 4. Int J Sport Nutr Exerc Metab. 2019. PMID: 30747558 Review.
-
The Kenyan runners.Scand J Med Sci Sports. 2015 Dec;25 Suppl 4:110-8. doi: 10.1111/sms.12573. Scand J Med Sci Sports. 2015. PMID: 26589124 Review.
Cited by
-
Modelling human endurance: power laws vs critical power.Eur J Appl Physiol. 2024 Feb;124(2):507-526. doi: 10.1007/s00421-023-05274-5. Epub 2023 Aug 10. Eur J Appl Physiol. 2024. PMID: 37563307 Free PMC article.
-
Construction of Women's All-Around Speed Skating Event Performance Prediction Model and Competition Strategy Analysis Based on Machine Learning Algorithms.Front Psychol. 2022 Jul 12;13:915108. doi: 10.3389/fpsyg.2022.915108. eCollection 2022. Front Psychol. 2022. PMID: 35910999 Free PMC article.
-
Special endurance coefficients enable the evaluation of running performance.Sci Rep. 2025 Jun 20;15(1):20184. doi: 10.1038/s41598-025-06009-6. Sci Rep. 2025. PMID: 40542038 Free PMC article.
-
Modelling 5-km Running Performance on Level and Hilly Terrains in Recreational Runners.Biology (Basel). 2022 May 22;11(5):789. doi: 10.3390/biology11050789. Biology (Basel). 2022. PMID: 35625517 Free PMC article.
-
Win Your Race Goal: A Generalized Approach to Prediction of Running Performance.Sports Med Int Open. 2024 Oct 9;8:a24016234. doi: 10.1055/a-2401-6234. eCollection 2024. Sports Med Int Open. 2024. PMID: 39439845 Free PMC article.
References
-
- Henry FM. Prediction of world records in running sixty yards to twenty-six miles. Research Quarterly American Association for Health, Physical Education and Recreation. 1955;26(2):147–158.
-
- Riegel PS. Athletic records and human endurance. American Scientist. 1980;69(3):285–290. - PubMed
-
- Katz L, Katz JS. Fractal (power-law) analysis of athletic performance. Research in Sports Medicine: An International Journal. 1994;5(2):95–105.
MeSH terms
LinkOut - more resources
Full Text Sources
Other Literature Sources
